Legends
home

Melbourne Ice Academy
Strategy
Introduction
? ? Author's Note — This is a technical study and resultant strategy plan in short-form. It employs data analysis and methodologies that are fairly commonly accepted in my professions. To the best of my knowledge, they have never before been adapted to ice sports centres, although they are employed by both public and private sectors for facilities as diverse as telecommunications operations centres, shopping centres, satellite earth stations, TAFE colleges, district centres and acute hospitals. I have strategically planned and designed each of those, and many other building types, networks and urban plans, for over 25 years. It is intended to fill a knowledge gap in the strategic location of ice sports centres in Victoria, although many of its principles can apply anywhere. The analysis addresses the perceived risk now associated with ice sports centres in this State, in the wake of a half-century of closures, in a language that governments, investors and their advisers will understand. A plan is also a powerful reason for acting. It will eventually be made available through the National and State libraries in the hope that some day, someone, may find at least some of it useful. In the meantime, most of it is provided here as a resource. It may be used freely without my permission, solely for funding and development of ice sports centres in Victoria. I apologise in advance for any complexities that I have not properly explained. It might appear to some to be just a bunch of numbers, but the general idea is actually surprisingly easy to understand, if you take some time to follow its ordinary logic. It basically says: compared to a model centre that we know to be economically viable, these specific locations are, or soon will be, sufficiently similar and, therefore, potentially viable; and most strategic for satisfying the needs of the largest number of prospective ice centre users in Victoria ... all things being roughly equal ... and providing certain basic planning, design and management outcomes are achieved.
— Ross Carpenter B Arch (RMIT) M Des (Urban Design) AAIA, Melbourne, March 2008
All rights reserved. Not to be reproduced without permission nor otherwise used for commercial gain, with the sole exception of funding and development of ice sports centres in Victoria.
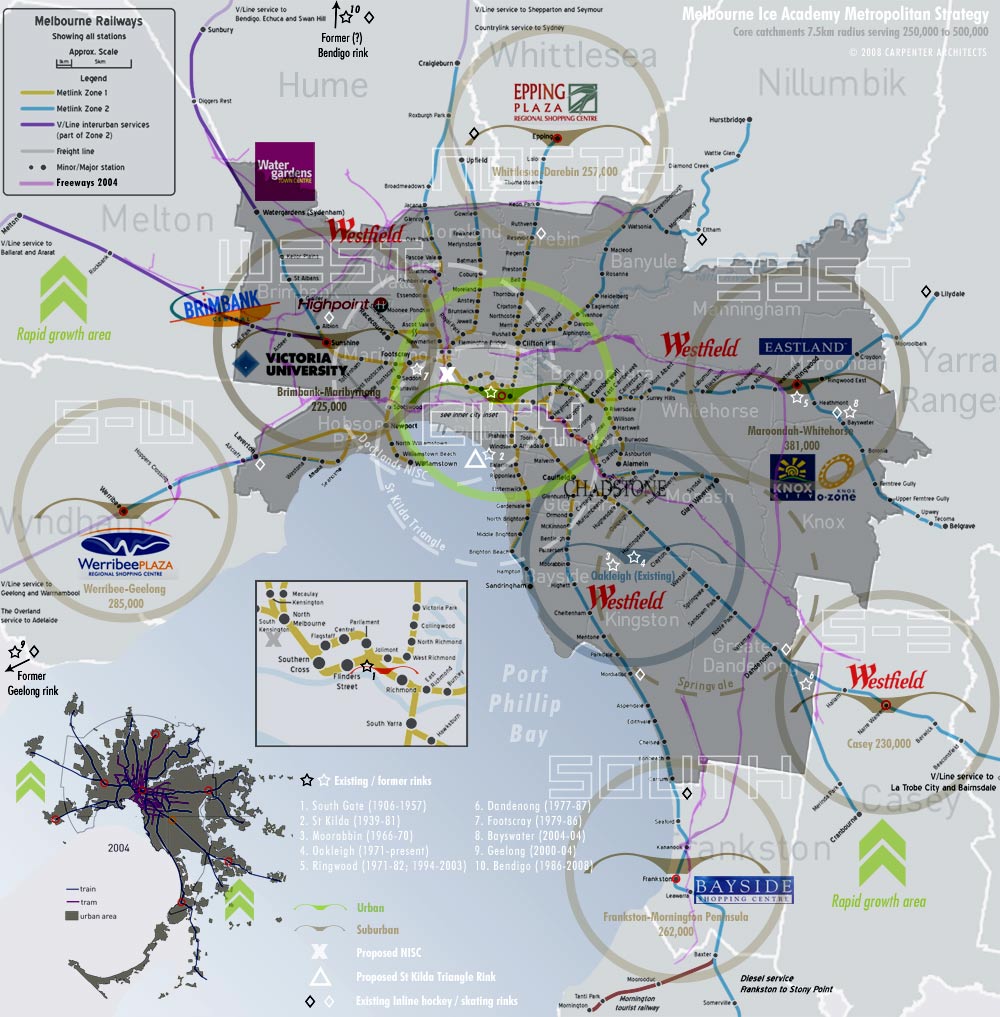
GIVEN ITS DEMOGRAPHY, Victoria's main twin-rink facility — it's Ice Academy — should be strategicaly located to be highly accessible to paying patrons via public transport; in a sports precinct in or very near Melbourne's central activity district. It should be on the eastern side where the majority of the greater metropolitan area population resides, to avoid unecessarily drawing potential users through the inner city to the west. Two others should be located in the south-east and north-west metropolitan population corridors (eg. Casey pop. 230,000 and Brimbank pop. 170,000); and, ideally, a third in the Eastern corridor (Whitehorse pop. 145,000). Two or three others should be located in outer metro and regional population centres, such as Werribee / Geelong (pop. 85,000 / 200,000), Frankston / Mornington Peninsula (pop. 121,000 / 141,000) and Ballarat / Bendigo (pop. 90,000 / 96,000). Some of those locations are similar to the spate of failed 'tin shed' rinks since the mid 1960s, but they didn't collapse because of their general location. The economic viability of future rinks depends on their purpose-built design and immediate proximity to the existing public transport network, which combine to largely determine drawing power and user catchment.
Melbourne has one of the largest rail systems in the world, with 15 lines. The Paris Metro is a third smaller, while San Francisco’s BART is less than half the size. Melbourne also has the biggest tram system in the English-speaking world. Its population density is higher than cities in the USA and similar to places with successful public transport, like Toronto in Canada. Overseas experts who have visited Melbourne say it has the ingredients to build one of the finest public transport systems in the world. Yet, presently, it is the most expensive city in Australia for public transport trips under 40km. For a number of unavoidable reasons, that will have to be improved, and future ice sports facilities should be located to capitalise on it — like the first rinks in Australia did a century ago. Access to public transport is partly why the 100-year history of ice sports facilities here is neatly divided in two: the half that laid the foundations, flourished and spread Nation-wide; and the half that barely survives.
Service Roles
A network heirarchy of ice sports centres is comprised of different service roles that are often determined informally by the catchment area, promotion and management of the individual centres. A three-level example is shown in the table below. Service offerings at commercial centres are usually determined by individual rink owners/managers in association with the controlling authorities of the various sports. For better or worse, that has traditionally been the case in Victoria since 1906. Centres that are partly or fully government funded, or otherwise subsidised, may be required to operate at a specified service level; ie., required to accommodate specific sports, activities and/or functions as a condition of funding or assistance. At the top of the heirarchy (Service Level 1), the main urban centre will draw from a much larger catchment than suburban centres, primarily because its central location bestows upon it the capability to viably sustain the most specialised services and facilities, for which there is least need or demand. It will therefore best operate as a highly accessible, centrally located 'National' facility, and its primary role will usually evolve to include hosting major National and International events; the most specialised ice sports; and elite athlete training and development.
The roles of suburban centres (Service Levels 2 and 3 in the example) will be responsive to the needs and demands of the local area in which they are located. In turn, they will be influenced by factors such as market opportunities, rink size, number of pads, promotion, and the resulting demand for local ice sports leagues/ associations and recreational (public) skating. A single ice sheet will obviously limit service offerings, and therefore demand, as will rink dimensions. The main economic advantage of a twin-rink facility is the ability to simultaneously operate say, public skating sessions on one, and ice hockey on the other, resulting in increased revenues with economies of scale in capital and operating costs. Single-rink facilities tend to have short public skating sessions and late scheduling of sports because of user demand conflicts, particularly in peak periods like weekends. Athletes and recreationalists are basically different user groups with overlapping ice time demands and thus, the market potential in a single-rink service area is rarely fully realised. In theory, a twin-rink centre has greater potential to be economically viable than a single rink, if it is well-designed; if it has a well-planned service role and catchment; and if it is well-managed and promoted. Three 'ifs' and they must all be largely satisfied.
| Service level | |||||
|
|
|||||
| Service Role | Authority | 1 | 2 | 3 | |
|
|
|||||
 |
Regional co-ordination + partnerships | ALL | |||
| National/Intern'l tournaments + events | ALL | ||||
| Athlete training + development | ALL | ||||
| In-residence hostel-style accommodation | ALL | ||||
|
|
|||||
| Olympic athlete training + development | OWI | ||||
|
|
|||||
| Ice Hockey — National (AIHL) | AIHL | ||||
|
|
|||||
| Ice Hockey — State (IHV) | IHV | ||||
| Ice Hockey — Local Leagues + Recreational | IHV | ||||
|
|
|||||
| Figure Skating / Dance | ISV | ||||
| Synchronised Skating | ISV | ||||
|
|
|||||
| Speed Skating — Long Track | VIRA | ? | |||
| Speed Skating — Short Track | VIRA | ||||
|
|
|||||
| Curling | VCA | ||||
|
|
|||||
| Recreational ice skating (general public) | RM | ||||
| Ice Shows (eg., International touring shows) | RM | ||||
| Other facilities and/or sports | RM | ||||
|
|
|||||
| Inline skating and/or hockey (all forms) | SV | ||||
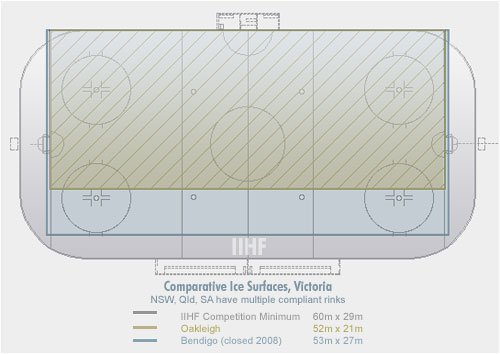
All the above sports and activities, except long track speed skating, can be accommodated on a 60m by 30m international-sized ice hockey rink. Long track speed skaters race on a two-lane oval similar in dimension to an outdoor athletics track. Indeed, an athletics track covered with ice can function as a speed skating track, such as Bislett stadion in Oslo, Norway, up to the 1980s. According to the rules of the International Skating Union, a standard track should be either 400m or 333.3m long; 400m is the standard used for all major competitions. Tracks of other, non-standard lengths, such 200 or 250m, are also in use in some places for training and/or smaller local competitions. On standard tracks, the curves have a radius of 25–26m in the inner lane, and each lane is 3–4m wide. The long track Olympic Oval in Calgary, Canada (image panorama below) is a good example. Two International-sized rinks are located within the long-track circuit. The cost of establishing and operating such a facility are many times higher than a twin-rink stadium without long-track facilities, and Melbourne is therefore unlikely to establish one in the forseeable future. The curling sheet, by World Curling Federation standards, is an area of ice 45.50m in length by 4.32m to 16.5m in width, carefully prepared to be as close to level as possible. Curling can therefore be played on an International-sized ice rink.
Inline hockey is a non-contact version of ice hockey, but on inline skates or roller blades. It is officially now the fastest growing sport in the world and in Victoria it is controlled by Skate Victoria. The first Skate Australia National Inline Hockey Championships were held in Melbourne in 1995, where teams from Queensland, NSW and Victoria participated. Today there are teams in Victoria, NSW, Queensland, SA and WA competing in all age divisions — Under 12, 14, 16, 18 and sometimes Under 20, as well as Junior Ladies, Senior Ladies, Senior Mens and Masters (over 35s). In 1994, the first World Championships, conducted by the Federation Internationale de Skate (FIRS) were held in Chicago, USA, with eight nations competing. Australia has been represented at every World Championship since 1994 and it is gradually climbing up the rankings against countries where ice hockey has been a long standing tradition. As well as the World Championships, Australia competes every year against New Zealand and other Pacific countries in the Oceania Inline Hockey Championships with teams in all divisions. Skate Victoria runs structured league competition from Under 10s through to Senior A on a weekly basis, in both Summer and Winter seasons, involving some 60 teams from 9 or 10 clubs. Victoria has a total of about 600 members – the largest in any state in Australia, and almost twice as many participants as ice hockey in Victoria. In addition to league competition, Skate Victoria also hold annual Victorian Club Championships to select players to represent the State at the Skate Australia National Inline Hockey Championships. For inline skating and hockey, changeover from ice to a timber floor can take as little as 3 hours using call-in workers; less to pull up. However, inline skating is not the best nor most economic use of an expensive ice centre, but it may nonetheless prove viable, for example, in metropolitan centres that are unable to develop and maintain economically viable ice sports alone. Apart from cost of changeovers and under-utilisation of ice plant capacity there are obvious synergies and spin-offs from co-locating both sports.
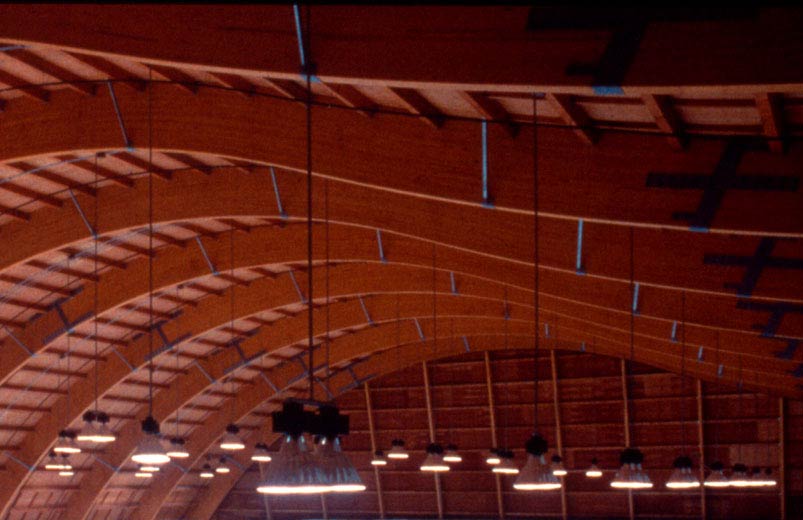
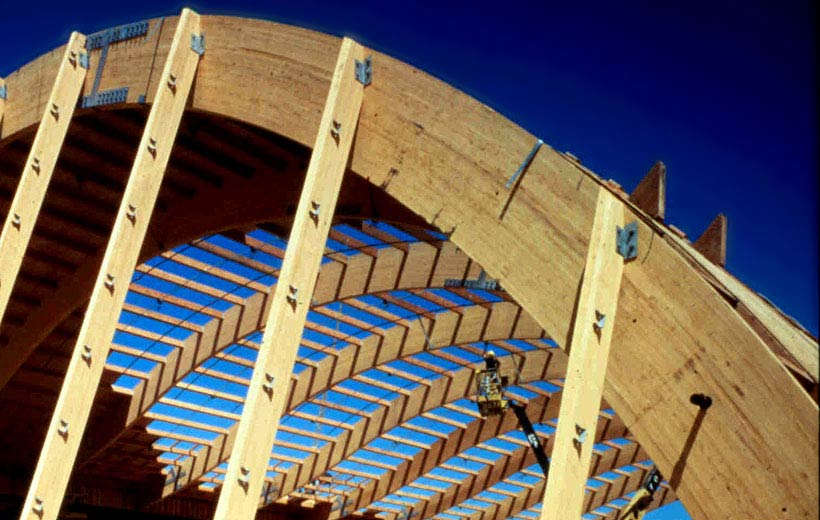
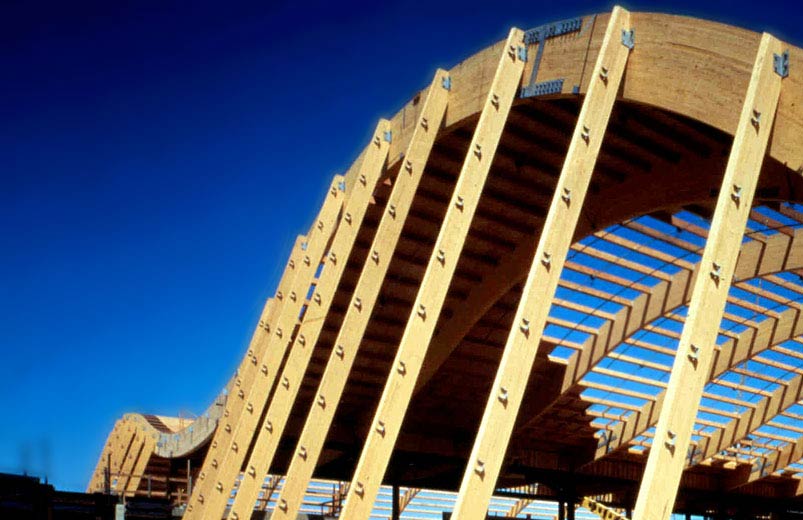
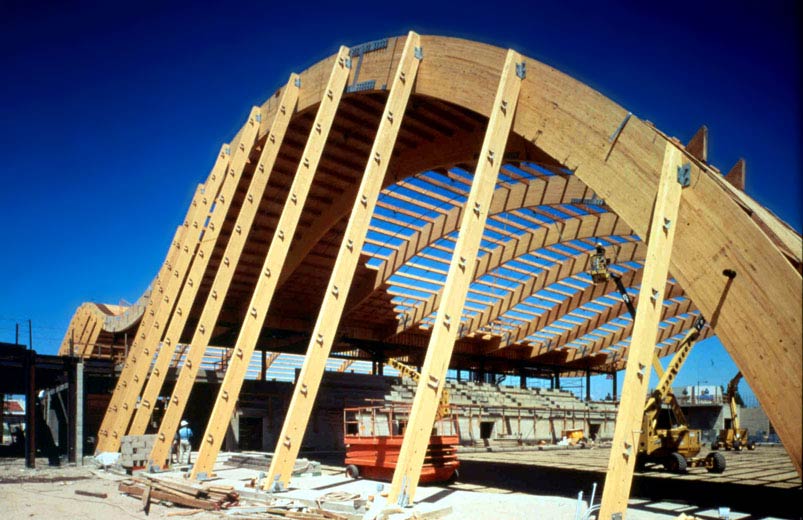
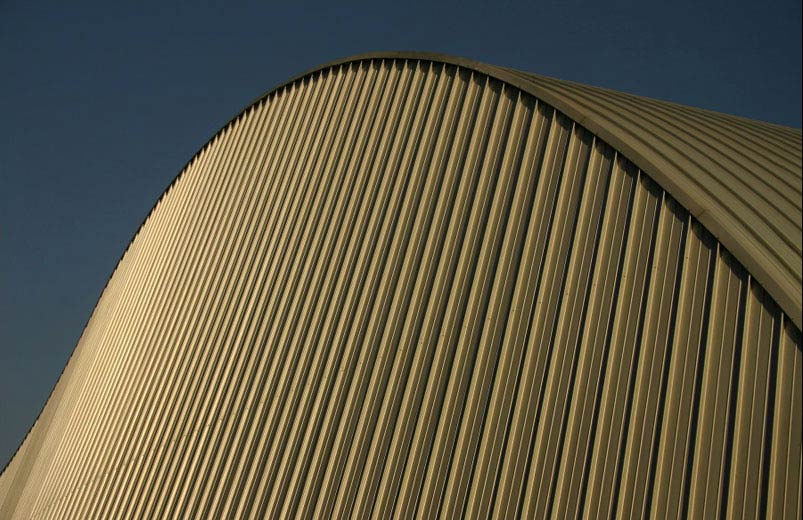
The Melbourne Ice Academy concept is a prototypical facility plan designed to expand from a single-rink to a twin-rink, with or without hostel-style accommodation for in-residence training such as development camps. It caters for all ice sports except long track speed skating and it is configurable to house either separate dedicated ice and inline rinks, and/or changeover floors from ice to timber. The prototype is therefore feasible anywhere in a rink network. It complies with "IIHF Rules for Ice Rinks" and relevant sections of their ice hockey development manuals.
Scale of Provision
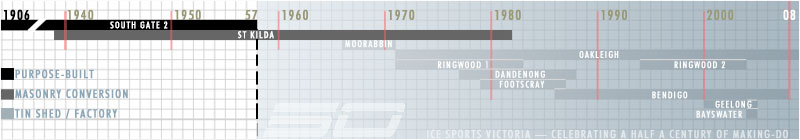
Melbourne has lost nine 'permanent' ice rinks over the past 37 years — one closure on average every 4 years. Running and replacement costs have crippled ALL make-shift rinks in tin sheds here over the past 40 years, except under-sized Oakleigh (est. 1971), which has cost proportionately less to run (though still very inefficient); received minimal capital improvements; and now has little or no property debt service. Others included Moorabbin (1966-70); Ringwood (1971-82; 1994-2003); Dandenong (1977-87); Footscray (1979-86); Bayswater (2004, closed same year); Geelong (2000-04) and Bendigo (1986-2007; re-opened 2008). Those leaky, rusting sheds either closed after a few years, or otherwise survived until the 7-11 year mark, when maintenance and replacement costs — on top of inefficient running costs, property lease payments or debt service — really began to bite. Like running your fridge with its door wide open. Efficient and durable ice arenas are designed to be airtight. The YMCA-run Bendigo rink lasted longer, but the problem was the same, except that local Council assistance prolonged its (un)economic life, even though a purpose-built facility has been mooted for years. Even St Moritz (1939-81) suffered poor ventilation and damp, causing the structure to rot from the early 1950s. The building it occupied was originally built in 1923 as a dance saloon and cafe. Melbourne's only purpose-built rink was Reid's Glaciarium Ltd, which survived in its two incarnations for over half a century. Cyclical costs, and their associated greenhouse emissions, can be substantially reduced with purpose-designed buildings and new carbon-neutral building and engineering services technology. These days, the extra capital outlay that requires is likely to be significantly offset by Sustainability Victoria grants (discussed elsewhere on this site).
The 5,500 ice rinks in Canada each serve an average 0.006 million people and the 2,200 rinks in the US each serve an average of 0.12 million people. Most US skating rinks are owned and operated by towns or cities, which subsidize their operations. NSW and Queensland have both lost rinks (Blacktown and Loganholme) but those presently operating there and in WA serve on average less than 1 million people. In SA, it's 1 per 0.8 million and less than 1 per 0.5 million in the ACT and Tasmania. On the other hand, Victoria has 1 rink per 5 million people. It will take 4 more rinks to make it comparable to the other larger States, and really five. Oakleigh is too small for International- or even National-standard competition and, 37 years on, it is run-down, inefficient and costly to use. Victoria has operated with five rinks, mostly 'tin sheds', during the late-70s and early 80s and again in the early years of the new century, until soon after the proposed National Ice Sports Centre at docklands was announced. During those same years, 2001-06, Melbourne experienced the largest population growth of all Australian capital cities, increasing by 273,000 people (or 150 people per day). The inner-city grew by just over 50%, but the largest and fastest growth occurred in the Melbourne suburban fringe LGAs of Casey (40,700 people or 4.1% per year) and Melton (28,100 people or 8.9% per year). Victoria also has a significant economic advantage over any other State because it has a higher population density and three-quarters of it is in greater Melbourne, accessible by a 15-line, radial metro train network that extends even farther to numerous outlying growth centres. Most of Melbourne's growth occurrs along those original rail corridors and their extensions, so it can viably support more than five rinks, provided they are well planned and designed.
 '
'
 'Permanent' ice rinks in Victoria since inception. Temporary rinks such as Ballarat not shown.
Service Catchments
The distance from which people will travel to use an ice rink generally defines its catchment area. Since ice rinks are highly specialised, they must be located to maximise catchment population and travel options whilst minimising travel time as much as possible. Travel options include transport modes but also factors like multi-purpose trips. An ice centre located in or near a busy shopping centre is likely to be used more often because potential users already make regular trips and combining both saves time, particularly for recreationalists. A location near a shopping centre and a railway station is even better, and so on. That is one of the main reasons that community facilities like libraries tend to now locate in shopping strips or regional shopping centres (there are many, but Eastland at Ringwood is a good example). The shopping centre also benefits from say, several hundred extra visits a week and perhaps much more. Low-cost sites in industrial estates remote from other activity in the catchment is actually the least attractive and least economically viable solution. In a well-planned metropolitan rink network, travel time for most users should average about 20 minutes or so, equal to about 15 km car travel. The number of people resident within that defined area is known as the catchment population. In practice, the actual catchment area is usually very irregular. For example, it will tend to be elongated along public transport routes and freeways and truncated by physical barriers such as freeways with limited crossings.
As a guide, the strategy adopts a notional core catchment area defined as the population resident within a 7.5 km radius of an ice centre (177 km2). In Melbourne's relatively densely populated metro area, that defines core service areas of 250,000 to 500,000 people at the main centres, which is roughly equivalent to the Newcastle locality model discussed below but, to varying degrees, more dense. All but three recommended outer locations and the regional centres have more people living in their core service areas than Newcastle's Hunter Ice Skating Stadium; 35 to 45 percent are in the age band targeted by ice sports (5-34 yrs); and access to the centres is comparable or better. Three of the new suburban locations are in the general area of former rinks (Ringwood, Dandenong, Footscray). A proportion of people living outside the core catchments will also travel to a facility, depending on a range of factors such as its service role (eg., sports or recreation only), access, alternative recreational offerings, pricing policy. To maximise rink viability, most proposed locations have been determined to also maximise drawing power from those secondary catchment areas, particularly in rapid growth areas and along regional rail corridors. Thus, the secondary catchments of each location will have additional but variable drawing power, depending on road and public transport access, diminishing gradually over a farther distance of about 30km beyond their core boundaries. Overlapping core catchments should be avoided because ice centres must then compete for the same patrons from the overlap, and economic viability of one or both rinks will usually reduce accordingly. That will only apply to service offerings common to both. For example, a Level 1 centre overlapping the service area of a Level 2 centre will be competing for its local league hockey, figure, speed and recreational skating patrons. The Level 2 rink is unlikely to be able to compete for the higher Level 1 service offerings. In a multi-rink network like that proposed, very few people in the greater metro and outlying urban areas will travel farther than 45km (1 hr travel time) to an ice centre, and most will be able to reach a centre in 30 minutes or less.
Outer metro locations and regional centres will usually have broader catchments and longer (but quicker) travel distances, more like the Newcastle locality model, although none of Victoria's regional centres are that large or dense. That is because three-quarters of the State's population live in Melbourne, and that is where most new growth occurs. The core and secondary catchments of 8 Melbourne metro locations will service the ice sports and recreational needs of over 80 percent of the whole State. Three outer metro locations (south, north and south-west) will rely heavily on the populations of both their core and secondary catchments, and so travel distances will be longer for many, and patronage comparable to the inner metro areas will have to be earnt. That is likely to change over the next 10 to 15 years. For example, the South-western location (Werribee) is projected to almost double in size. Like them, the regional centres also rely on both core and secondary catchments, but the latter are usually smaller and more widely spread compared to the outer metro locations. Geelong will be able to comfortably sustain a viable ice centre at some point over the next 10 years. Bendigo is least viable, although it is steadily growing, but slowly. The strategy considers short- and long-term solutions for both of the two largest regional centres. The City and Western Suburbs centres should each have hostel-style accommodation to enable in-residence training and development and to help reduce the cost of participation in Regional centres like Bendigo. Similar accommodation should also be considered at all other locations, and most particularly at outer suburbs with regional drawing power.
The economic viability of centres also depends on participation and factors influencing it, in addition to factors such as catchment size, access, ice centre design and operating efficiency. A recent household survey of participation in sport in Canada found that there were four patterns to participation that stood out and ice hockey, a part of the traditional Canadian identity, stands in a class of its own as the most popular sport in each category. It attracted 1.66 million adult active participants, over a million volunteers and more than 5 million attendees in 2004—altogether, more than one-fifth of the entire adult population of Canada, and nearly half of all Canadian adults who attended a sporting event. The most significant pattern identified in the survey involves sports that attract large numbers of adults in all three categories: active participation, volunteering and attending. Ice hockey (along with baseball, soccer, volleyball and basketball) fits this pattern, and one reason it is so popular is that it is a team sport with important family associations for many people. It is often played by several members of a family at the same time, including both adults and children, which may encourage other family members to seek to share in the experience by volunteering and attending. Team sports are able to draw significantly larger numbers of participants overall than are sports geared essentially for individuals. The visible presence of popular professional leagues is also a factor. Most are also broadcast widely and prominently throughout Canada, creating popular role models whom people want to emulate, thus building a broad constituency for participation.
Like ice hockey, ice skating also inspires a depth of dedication that draws many adult attendees and volunteers, but it has a different participation pattern because it attracts relatively few active adult participants. The study also found that the key drivers of participation in sport include age, gender, household composition, educational attainment and income. Active participation strongly correlates to age, falling steadily through to the senior years. Men are much more likely than women to be active participants in sport. The gap is longstanding and does not appear to be closing in Canada, but men and women partcipate in sports fairly evenly in Australia. The presence of children in the household has a significant impact on the pattern of adult participation in sport, especially adult volunteerism, which doubles. People with high incomes are much more likely to participate in sport than are people who earn less. Similarly, the greater someone’s education, the more likely he or she is to participate.
The table below  broadly summarises the relative size, growth rankings, economic resources and socio-economic disadvantage at strategic ice centre locations. It includes pointers to areas within catchments that contain significant numbers of prospective participants who daily contend with socio-economic barriers of one form or another. Greater detail is provided for each locality in later sections (links in table). The Index of Relative Socio-economic Disadvantage (IRSD) focuses on indicators such as low-income earners and high unemployment. It takes into account variables relating to income, education, occupation, wealth and living conditions. A score of less than 1000 means more disadvantaged (deprived) than National average and more than 1000 is less disadvantaged than average. The Index of Economic Resources (IER) highlights disposable income and the economic resources of households in the service area. It reflects the income and expenditure of resident families, such as wages and rent. Variables which reflect wealth (such as dwelling size) are also included. Higher scores indicate the catchment area has a higher proportion of families on high income, a lower proportion of low-income families and more households living in large houses of four or more bedrooms. A low score indicates the ice centre service area has a relatively high proportion of households on low incomes and living in small dwellings. Most IER and IRSD scores lie between 800 and 1200 State-wide, and there is no meaningful arithmetic relationship between them (for example, an area with a score of 1200 is not twice as advantaged as one with a score of 600). They are best understood relative to each other and to the National average (1000). Lower than average economic resources and/or disadvantage scores in a core and/or secondary catchment is likely to mean lower participation levels than average. Reduced participation rates are also likely to be highly correlated to the relative costs of participation in each ice sport, and also to available sport and recreation alternatives that are more-affordable or accessible.
| Target population x age band | ||||||||||||||||
|
|
||||||||||||||||
|
[ new window ] | SEIFA | Vic Growth Rank 4 | Jnr | Snr | Open | All | % Tot | ||||||||
|
|
|
|
||||||||||||||
| Location | Core service areas 1 | Priority | Level | Timing | IER 2 | IRSD 3 | Fastest | Largest | Pop/km2 | Total | 0-4 | 5–14 14 | 15–19 | 20-34 | 5-34 | 5-34 |
|
|
||||||||||||||||
 |
||||||||||||||||
| City (strategy: Melbourne Park) | 1 | 1 | Now | 966 | 1081 | 19av | 14av | 2,882 | 510,101 | 24,583 | 35,780 | 26,182 | 185,464 12 | 247,426 | 48.5% | |
| • Docklands (proposed NISC) | ? | |||||||||||||||
| • St Kilda (proposed) | 2010 | |||||||||||||||
|
|
||||||||||||||||
 |
Oakleigh (Existing) | – | 3 | - | 975 | 1067 | 33av | 17av | 3,324 | 588,415 | 33,985 | 66,223 | 37,561 | 126,678 | 230,462 | 39.2% |
|
|
||||||||||||||||
| Oakleigh (post-St Kilda) 5 | – | 3 | 2010 | 956 | 1054 | 40av | 16av | 2,262 | 400,348 | 22,182 | 43,073 | 25,658 | 92,933 | 161,664 | 27.5% | |
| Western (Sunshine) 6 | 2 | 2 | Now | 933 | 988 | 41av | 31av | 2,165 | 383,185 | 24,045 | 46,521 | 24,509 | 91,766 | 162,796 | 42.5% | |
| South-eastern (Narre Warren) 7 | 2 | 2 | Now | 1077 | 967 | 14av | 8av | 1,752 | 310,233 | 23,271 | 48,227 | 22,272 | 69,989 | 140,488 | 45.3% | |
| Eastern (Ringwood) | 2 | 2 | Now | 944 | 1063 | 46av | 28av | 1,845 | 326,629 | 19,717 | 40,841 | 22,385 | 66,314 | 129,540 | 39.7% | |
|
|
||||||||||||||||
| Northern (Epping) 8 | 3 | 2 | Now | 971 | 971 | 12av | 9av | 1,194 | 211,350 | 14,126 | 28,377 | 14,940 | 49,026 | 92,343 8 | 43.7% | |
| Southern (Frankston) 9 | 3 | 2 | 2013 on | 1021 | 1012 | 20av | 12av | 966 | 171,044 | 10,965 | 23,842 | 12,473 | 34,097 | 70,412 9 | 41.2% | |
| South-western (Werribee) 10 | 3 | 2 | Now | 970 | 1028 | 3 | 2 | 1,540 | 116,001 | 9,420 | 18,110 | 8,551 | 27,390 | 54,051 10 | 46.6% | |
|
|
||||||||||||||||
 |
Geelong | 4 | 2 | 2013 on | 1001 | 1022 | 18 | 7 | 166 | 205,929 | 12,407 | 27,005 | 14,405 | 39,893 | 81,303 | 39.5% |
| Bendigo (Existing + proposed) 11 | 4 | 3 | ? | 1009 | 999 | 34 | 15 | 41 | 126,284 | 7,569 | 17,567 | 9,171 | 22,206 | 48,944 | 38.8% | |
|
|
||||||||||||||||
| Model (Warners Bay, NSW) 13 | 995av | 983av | 48av | 16av | 700 | 341,030 13 | 19,913 | 42,758 | 23,485 | 68,105 | 134,348 | 39.4% | ||||
Data sources: ABS 2006 LGA population estimates. ABS 2001 Socio-economic Indices For Areas (SIEFA). Both most current available in Mar 2008. [1] Uniformly 177 km2 excluding secondary catchments beyond a 7.5 km radius of ice centre locations. [2] IER = SEIFA Index of Economic Resources: < 1000 = less resources (disposable income) than National average; > 1000 = more resources. [3] IRSD = SEIFA Index of Relative Socio-economic Disadvantage: < 1000 = more disadvantaged (deprived) than National average; > 1000 = less disadvantaged. [4] Average of ABS Population Growth Rank indices for LGAs comprising each core catchment. Valid for comparison in this table only. [5] Likely to reduce to 400,000 when St Kilda Triangle rink is established. Impact depends on St Kilda service offerings. [6] Secondary catchment contains rapid growth corridor (Melton) and other high-growth areas. [7] Narre Warren is preferred long-term strategy. Dandenong alternative discussed below. [8] Core viable in 5-10 years. Viable short-term due to growth areas in secondary catchment, including Craigieburn, Roxburgh Park and Whiittlesea. [9] Southern core is only about half the size of main suburban centres, but secondary catchment is 75% as large again. [10] South-western core is about one-third the size of main suburban centres, but secondary catchment (Geelong) is over twice as large again. [11] Closed and re-opened 2008. Regional catchment 3,048 km2 plus low density secondary catchment beyond about 30 km radius of ice centre location. [12] Jnr and Snr age bands are comparable to metro catchments but 'Open' age band is 2 to 3 times their size (see next section). [13] Population of catchment within 15 km radius of ice centre, as with Vic regional centres (metro catchment data are within 7.5km radius of ice centre location). [14] 5-14 age band is usually split about 50-50 between 5-9 yrs and 10-14 yrs components. |
||||||||||||||||
Community initiatives such as skating programs, sponsorships, tuition assistance and others that can similarly improve affordability or access to a centre's offerings, are likely to be most effective in these areas by helping to tap the full potential of a centre's service catchment. They could be operated by development councils through local youth workers and associations, schools, community support groups and/or sponsors. There are several programs operating overseas that could serve as models, having demonstrably increased participation, and simultaneously provided a valuable social service. The IHA Mighty Roos Kids Club and its trial 'Learn to Play' program have related objectives, but they need to be designed and operated locally (in any event, 'Learn to Play' doesn't appear to have developed beyond one event at Blacktown). Given the participation problems in the youngest age band, Victoria would benefit from its own Club and program for 6 to 8 year olds, with Melbourne Ice as the focus, not the Mighty Roos. A second program for youth who need assistance, modeled on the Disney 'Goals' program, could be promoted through local newspapers and pamphlets at inline rinks, Council outlets, shopping centres and the like. To be effective, they need to reach out widely, at least from each main strategic location, even though ice activities can presently only be conducted at Oakleigh. They would work best established and overseen by the IHV Development Council, but they could be resourced through volunteers and sponsors to help cover the cost advertising and promotional material.
Regular equipment drives can help to build a pool of hand-me-down skates, helmets, sticks and gloves for entry-level participants, perhaps encouraged by a Melbourne Ice or IHV donor badge. Shifting the present culture a little from shooting goals, to helping others to shoot goals, would not be a bad thing in Victoria, in more ways than one. Over time, programs that reduce the cost of participation for young people who are disadvantaged, who have limited resources, or who have access difficulties, will be able to be integrated and largely co-ordinated through existing youth work and welfare organisations. A handful of programs are likely to become self-regulating referral services and a source of inspiration for ice sports. Even focused on the least-costly basics of ice skating, they will contribute to the usage of ice facilities, and may later lead to participation in one or other sport, with or without continued assistance.
In Victoria, IHV's Development Council is one of ice sports' finest assets. It will be more effective at increasing participation levels when more volunteers and ice time are dedicated to separate out-reach programs for each main skill-development group, rather than combined as one. For example, NSW Clubs run their own development sessions. Some, like the Liverpool Saints, cost as little as $5.00 per session. Others, like the Canterbury Eagles, are $15.00 per session with all gear supplied. In Melbourne, the cost is $16.00 per session including coaching, use of hire skates, helmet and hockey stick. On top of that, insurance and IHA membership of $58.00 p.a. (under 18) or $71.00 p.a. (over 18) is also payable. That presents an unnecessary affordability barrier at entry-level. Initially, prospective players should not have to pay for IHA membership when they don't benefit from the services, and insurance should be no different to public liability cover held by the rink for any other public skater. IHNSW are also attempting to use its new website, which has now registered over 7 million hits, to draw prospective sponsors to assist in ice hockey development and training in NSW: "with an unmatched reach to the sport’s prime target audience, IHNSW has a limited number of cost-effective Sponsorship Packages now available". The 'packages' are 5 banner spaces offered to sponsors at $5,000 each. In 2004, when IHA's National Junior Team won the International Ice Hockey Federation Div III U20 World Championship in Bulgaria (each over $6000 out of pocket to compete in the event), it also joined elite company as a member of the NHL.com Network. IHA became the first ice hockey association in the world outside of North America to be granted affiliation with the NHL.com Network. The deal, which ranked IHA alongside Hockey Canada, gave hockey fans across the globe instant access to stories and statistics of hockey Down Under as well as the men's senior national team, the Mighty Roos. NHL.com is the sixth most popular sports website in the world and plays a major role in educating the global hockey community about the sport in Australia.
IHV would do well to develop and expand both their website and their Development Council beneath the Director, with a dedicated fundraising officer, a program liaison officer to work with community organisations (both focused on promotion and recruitment), and energetic on- and off- ice co-ordinators for Pee-Wee, Bantam and Junior Elite age groups. In many crucial ways, the sport's future lies in their hands; their creativeness. Participation rates show that for every thousand children contacted through promotions, there will be just one or two new recruits. That's a task that needs to be approached by working smarter, not harder; a task for more than one. Only when you are finally resigned to that need and its enormity; only then does it enter the realms of possibility. And only from there, can it be tackled.
Participation
Participation in ice sports occurs through active participation, volunteering and attending. Active participation rates for ice hockey can provide a good indication of the potential to increase participation in all ice sports, through better utilisation of existing ice capacity and delivery of new ice centres. The rates are a standardised measure of the actual number of participants each ice centre draws, in this case, from every thousand potential participants in its own catchment. They enable comparison of ice centres relative to each other and as such, they are a good indicator of relative drawing power. In 2007, there were about 315 competition ice hockey players registered in the Melbourne metro area, and about 42 at Bendigo (IHV:2008). There were a few more 'development' players under 13 years of age, but their numbers were insufficient for league competition. Victoria had only about 11 percent of the 3,200 players registered across Australia, yet its population is almost equal to the largest State (and soon will be). Its share of total National population is just 8 percent less than NSW. Victoria usually does well in National and AIHL competition because the focus there has been on producing quality, at the expense of player numbers. It is learning the hard way that, in the long-run, a balance of both are vital; each sustaining the other. By the start of 2008 in Victoria, the downward trend in participation had showed no signs of stabilising. The number of Junior league players in particular had again dropped significantly.
| Current participation rates, ice hockey, Victoria, 2008 | |||||||||
| Oakleigh | Bendigo | Total (State) | |||||||
|
|
|
|
|||||||
| Age band | No. | Pop. | /000 | No. | Pop. | /000 | No. | Pop. | /000 |
|
|
|||||||||
| < 16 | 78 | 66,223 | 1.2 | 8 | 17,567 | 0.5 | 86 | 83,790 | 1.0 |
| 16-18 | 73 | 37,561 | 1.9 | 4 | 9,171 | 0.4 | 77 | 46,732 | 1.6 |
| Open | 164 | 126,678 | 1.3 | 30 | 22,206 | 1.4 | 194 | 148,884 | 1.3 |
|
|
|||||||||
| Totals | 315 | 230,462 | 1.4 | 42 | 48,944 | 0.9 | 357 | 279,406 | 1.3 |
Base data source: IHV, 2008 (player numbers); excluding Juniors playing in higher grades. Very young players not included. Presently insufficient numbers for competition. Population data: ABS 2006 by collector district; see summary tables in previous section. |
|||||||||
A National survey taken in Australia a few years after the Canadian survey, showed ice and snow sports among the Top 20 most popular sport and physical recreation activities (ABS:6). They ranked 19 in Victoria and 22 in NSW, but they were not in the Top 30 in Queensland. By far, the larger proportion are snow sports participants in the two States that have skiable snow in winter. Participation in ice and snow sports in Victoria is just 1.2% of total participation in all sports and recreation, and ice hockey represents less than 1 percent of that. Interestingly enough, ice and snow sports were more popular than rugby in both Victoria and NSW. Soccer ranked 8th in NSW and 13th in Victoria. Over one-third of people either walk or attend aerobics/ fitness programs, both of which are very accessible. In fact, the Top 10 are all highly accessible in Victoria. All people who walked, and most who were involved in aerobic/fitness activities, participated in a non-organised capacity only. Overall, about 42 percent participated through organised clubs or associations, and the highest participation rates were reported by people aged 25–34 years (75%) and 15–17 years (75%). Males (66%) and females (66%) participated equally.
In terms of family-type, members of group households (75%) participated most, followed by those in couple families with dependent children (70%) and couple only households (68%). People living in lone person households had a relatively lower rate of participation (60%), and those living in multiple family households with dependent children had the lowest participation rate (41%). In terms of employment status, people who were not in the labour force had the lowest rate of participation. Among non-participants, an estimated 1.7 million people indicated that insufficient time due to work or study was a common constraint to participation (23% of responses). Simply being 'not interested' in sport or physical activity was the second most common reason given (19% of responses). Almost half (47%) of people aged 15–17 years who were asked about their participation indicated lack of interest as their main reason for not participating. A variety of reasons were reported as motivators including health and fitness (33%), enjoyment (21%), well-being (16%) and social or family reasons (14%).
The most popular Australian sports, structured or unstructured, are all highly accessible to their participants. Like ice hockey, six are team sports, but their participation costs are comparatively little, and they have long ago built a broad constituency for participation. These three simple things — easy access, low-cost and broad constituency — recur like threads through each of them, but not through ice sports. Strategies that improve the existing conditions in these three key areas, however little they appear by comparison, will significantly improve participation. For working examples, look no farther than interstate. Making ice sports more available to those in the community who are most affected by those factors — the disavantaged and less resourced — will improve participation even more; more so than anywhere else in Australia at the present time.
| Participation in Sports, Victoria, 2005-06 | |||||||
| Males | Females | Persons | |||||
|
|
|
|
|||||
| No. | Part'n | No. | Part'n | No. | Part'n | ||
| Sport or recreation | ('000) | Rate | ('000) | Rate | ('000) | Rate | |
|
|
|
||||||
| 1 | Walking for exercise | 299.7 | 23.9 | 671.9 | 32.7 | 971.6 | 24.1 |
| 2 | Aerobics + fitness | 164.2 | 8.3 | 312.5 | 15.2 | 476.7 | 11.8 |
| 3 | Swimming | 136.5 | 10.9 | 186.8 | 9.1 | 323.3 | 8.0 |
| 4 | Cycling | 158.0 | 12.6 | 98.1 | 4.8 | 256.1 | 6.4 |
| 5 | Golf | 187.0 | 14.9 | 49.9 | 2.4 | 236.9 | 5.9 |
| 6 | Tennis | 90.2 | 7.2 | 101.1 | 4.9 | 191.3 | 4.7 |
| 7 | Running | 116.8 | 9.3 | 54.2 | 2.6 | 171.0 | 4.2 |
| 8 | Australian rules football | 120.8 | 9.6 | 11.7 | 0.6 | 132.5 | 3.3 |
| 9 | Netball | 19.7 | 1.6 | 107.2 | 5.2 | 126.9 | 3.2 |
| 10 | Cricket (outdoor) | 110.6 | 8.8 | 3.2 | 0.2 | 113.8 | 2.8 |
| 11 | Bush walking | 41.4 | 3.3 | 71.0 | 3.5 | 112.4 | 2.8 |
| 12 | Basketball | 70.3 | 5.6 | 36.1 | 1.8 | 106.4 | 2.6 |
| 13 | Soccer (outdoor) | 64.0 | 5.1 | 12.8 | 0.6 | 76.7 | 1.9 |
| 14 | Lawn bowls | 46.5 | 3.7 | 21.1 | 1.0 | 67.7 | 1.7 |
| 15 | Yoga | 5.2 | 0.4 | 59.7 | 2.9 | 64.8 | 1.6 |
| 16 | Soccer (indoor) | 56.6 | 4.5 | 6.3 | 0.3 | 62.9 | 1.6 |
| 17 | Fishing | 49.2 | 3.9 | 5.4 | 0.3 | 54.6 | 1.4 |
| 18 | Dancing | 13.1 | 1.0 | 37.3 | 1.8 | 50.5 | 1.3 |
| 19 | Ice + snow sports | 32.2 | 2.6 | 18.1 | 0.9 | 50.3 | 1.2 |
| 20 | Martial arts | 28.4 | 2.3 | 21.6 | 1.1 | 50.0 | 1.2 |
|
|
|
||||||
| Data source: Participation in Sports and Physical Recreation, Australia 2005-06. | |||||||
Projected participation levels and team numbers are summarised below for the core service areas of Oakleigh, and the four high-priority ice centres. 'Min' participation rates are based on the Bendigo experience by age band, and 'Vic' rates are similarly based on the median participation from both Bendigo and Oakleigh catchments. On present demand, the core service areas of these four future ice centres would have sufficient potential to at least triple participation in this sport. There would be demand for about 77 teams, competing at 5 ice centres (excluding Bendigo). On average, at least 7 or 8 matches would take place at each centre, each week of the regular season, with a similar number of training sessions; perhaps more. There would be greater additional capacity throughout the network and schedules could probably increase from the current 15 rounds, to any number up to 30, since ice hire costs would be lower through price competition. A 15-round ice hockey competition and training could generate about $100,000 per annum on average for each centre, or up to $200,000 per annum with a 30-round schedule. In addition, there would be greater spectator participation, some of which would be paid entry, as well as corporate box and sponsorship income. Public skating would be similar, and with twin pads it could double again. Then, there is the balance of ice sports, such as speed and figure skating and curling, plus any other activities arranged by the centre (such as discos, parties, ice shows, etc). However, on the other side of the equation, are the running costs and debt service. An investment loan of just $5 million at 9 percent interest over 25 years will require a debt service of over 0.5 million per annum. Run that out to $25 million and the annual debt service is over $2.5 million. It should be clear that revenues and projected participation levels are critical to the decision to invest in an ice centre or not. In the past in Victoria, they have never been sufficient to support the right level of capital expenditure on the facility. Developers have cut capital outlays to reduce debt service, survived until it caught up with them, then closed.
| Indicative participation levels, ice hockey, 5-rink network, Victoria, 2008 | |||||||||||||||||
| Per current State participation rates | Potential | ||||||||||||||||
|
|
|
||||||||||||||||
| [ new window ] |
Jnr (5–14) | Snr (15–19) | Open (20-34) | Total (5-34) | Total (5-34) | ||||||||||||
|
|
|
|
|
|
|||||||||||||
| Min 1 | Vic 2 | Av # | Min 1 | Vic 2 | Av # | Vic 2 | Av # | Min 1 | Vic 2 | Av # | Model 3 | Model # | |||||
| Core service areas | Priority | Pop. | 0.5/000 | 1/000 | Teams | Pop. | 0.4/000 | 1.6/000 | Team | Pop. | 1.3/000 | Teams | 0.9/000 | 1.3/000 | Teams | 2.2/000 | Teams |
|
|
|
||||||||||||||||
| City [strategy: Melbourne Park] | 1 | 35,780 | 18 | 36 | 2 | 26,182 | 10 | 42 | 3 | 185,464 | 241 | 16 | 269 | 319 | 21 | 544 | 36 |
|
|
|
||||||||||||||||
| Oakleigh [existing] | – | 66,223 | 33 | 66 | 4 | 37,561 | 15 | 60 | 4 | 126,678 | 165 | 11 | 213 | 291 | 19 | 507 | 34 |
| Western [Sunshine] | 2 | 46,521 | 23 | 47 | 3 | 24,509 | 10 | 39 | 3 | 91,766 | 119 | 8 | 152 | 205 | 14 | 358 | 24 |
| South-eastern [Narre Warren] | 2 | 48,227 | 24 | 48 | 3 | 22,272 | 9 | 36 | 2 | 69,989 | 91 | 6 | 124 | 175 | 12 | 309 | 21 |
| Eastern [Ringwood] | 2 | 40,841 | 20 | 41 | 3 | 22,385 | 9 | 36 | 2 | 66,314 | 86 | 6 | 116 | 163 | 11 | 285 | 19 |
|
|
|
||||||||||||||||
| Totals | 119 | 238 | 16 | 53 | 213 | 14 | 702 | 47 | 874 | 1,153 | 77 | 2,004 | 134 | ||||
[1] 'Min' = actual participation rates in Bendigo, 2007, from table above. [2] 'Vic' = actual median participation rates of Oakleigh and Bendigo from table above. [3] 'Model' = actual participation rates from the model service catchment (Warners Bay, NSW). [4] Teams are sized on the number of players and goaltender averaging 15. |
|||||||||||||||||
Those projections only reflect present rates in Victoria, not achievable future potential. For example, the participation rate at the model service area (Warners Bay) is much higher at over 2.2 players per 1,000 population in the target age bands. Compared to the model, Bendigo operates well below the potential in its catchment, particularly in the Junior and Senior age bands. It's participation rates are of limited use for projecting future potential. They might better represent minimum participation; the lower end of that which is is potentially achievable. Oakleigh is a strange aberration. Participation levels there reflect neither its own catchment, nor the broader metro area. It draws participants from a much wider service area than its true catchment because it is the only Melbourne metro ice centre. From time to time, it operates at or near the limit of hockey matches it can schedule, beyond which there is little further capacity. However, the number of players participating in those teams are also well below true potential. The ice centre still gets paid for the ice-time, but the cost is borne by fewer participants, which means they pay more. As the cost of participation increases, participation again drops accordingly. When it drops further, the costs per participant again increase, with obvious consequences, and the sport enters a self-defeating, downward spiral.
Organisers intervene to maintain some kind of cost parity and so stabilise participation levels, by shortening match schedules and/or reducing related costs. Ice centre revenue can soon be affected unless the spare ice capacity is otherwise able to be utilised to replace lost income. That is usually only possible if it falls inside peak periods of public usage, or if it can be re-scheduled to generate income. If not, ice rates will often rise to cover the shortfall, placing further downward pressure on participation. Ice centres often only discover that is no solution at all, when it is too late; when it is fatal. In the meantime, participants who feel the financial pinch, cut-back or eliminate their related expenses, such as equipment and participation in discretionary Club fundraising events. Some cut-back by choosing to play one, not two, leagues; others choose between sports, like ice versus inline; some have no choice and simply drop-out. The sport's organisers are now aware of this and they have restructured local leagues in an attempt to address it. Key factors contributing to reduced participation were identified as team imbalances; the reducing quality of ice hockey competition; and the rising cost of participation. There are others, such as organisational culture, promotion, facilities and access. But the underlying problem is that Oakleigh, like Bendigo, does not draw participation sufficiently, not even from its own core catchment — even though it is much larger and less socio-economically disadvantaged than the model catchment. And, in fact, it is even much, much larger than that, because it is the sole provider and presently has the luxury of drawing from the whole metro area.
IHV adopted their review recommendations and so delivered substantially reduced costs for the 2008 Winter season despite, as they say, increases in IHA capitations (fees) and ice hire; the new cost of paying off-ice officials for Seniors; and inclusion of finals costs. Cost reductions inclusive of finals are 30 percent for Pee Wee (U14); 13 percent for Bantam (U16) and Junior Elite (U18); and about 20 percent for Premiers (Seniors, 18 and over). Costs for Bendigo players are now less than Melbourne by 20 percent for Pee Wee; 30 percent for Junior Elite and 25 percent for Premiers. That was achieved through a number of changes, but primarily by a reduced 15-round schedule; down from 18. There will be less ice time for all participants, but it is proposed to be better quality. Melbourne players can now participate for $25.00 to $33.00 per round, depending on age band, including game and training. Bendigo players will pay $20.00 to $25.00, and no-one will pay extra for the finals. Other key proposals that should positively influence participation include a shift to a culture where positions in teams are earned; a junior hockey structure based on ability not age; and a more even competition. Volunteer and attendance participation should also be assisted by better arrangements for match day duties, including some paid officials in senior grades. Teams sports like ice hockey are attractive to many people because they support important family associations. Many of these proposals should relieve some of the pressure on them and, importantly, so help to improve the sport's overall organisational culture.
The IHV review was a well-targeted, necessary step in the right direction for creating an environment to restore seriously depleted active and volunteer participation numbers. But, at best, that's all it will achieve unless the message goes further; unless it reaches prospective new participants. Despite this excellent start to a much-needed IHV overhaul, the harsh reality is that the sport in Victoria is still very much in trouble, and was left with little choice but to downsize yet again. In 2007, it lost its Under 13 league due to insufficient player numbers, and limped through a largely non-competitive Club season. In 2008, further decline forced game schedule reductions of 17 percent across the board; a merger of one of six Senior clubs; and disbanding of all Junior hockey teams. Clubs no longer have Juniors. They play in three IHV junior leagues comprised of just four centralised clubs. The IHV restructure contains the seeds for some improvements, but there is now also less hockey being played in Victoria than there has been for a long while, and organisers are simply reacting to accelerating decline; seemingly unable, or perhaps unwilling, to deal with its root causes. Certainly, that will now take some real effort. Meanwhile, the sport is developing in other States more rapidly than ever before. In fact, the number of roller rinks in NSW, not ice rinks, is now at an all-time low due to land values, sky-high insurance costs and flagging interest. Sydney, which had 14 roller rinks a little over five years ago, now has only two. Most rinks closed in the past five or six years. Sydney had been particularly hard hit, because selling the land was more profitable than running a rink, yet that has not affected its ice rinks. They not only endure; their usage grows. Outward growth in Sydney is constrained by the Blue Mountains and so it's urban land is limited and expensive compared to Melbourne. Regional centres like Newcastle grow more compared to regional centres in Victoria, partly as a result. The advent of rollerblades, which can be used in parks and on streets and promenades, has also compounded the problem. In Victoria, inline skating sports continue to rapidly grow. Inline hockey now has almost twice the membership of ice hockey.
Potential: virtual ice
Projected potential in this future network of ice centres total 134 teams, made-up of around 2,000 players (last two columns, table above ). On present age distribution, Junior (5-14) and Senior (15-19) age bands would each have about 20 percent of the total, or 27 teams apiece, with the balance being 'Open' age band (20-34). That can be influenced by organisers through determinants such as promotion of the sport, entry-level pricing policy, and development program cost and quality. Projected participation is potentially over six times the current level in Victoria. In this first phase of the strategy, participants would be drawn primarily from the CORE service areas of Oakleigh and the four additional, strategically-located ice centres. As such, the projections are based on the target populations within a 7.5 km radius of each centre. They are conservative and do not factor potential participants from secondary catchments beyond that distance. Competition for participants from the core service areas of other ice centres will be minimal since they do not overlap, but there would obviously be healthy price competition between five centres, which is presently lacking. There is also potential for an AIHL team at each of these locations, when a sufficient number of participants reach those skill levels. As such, the potential player and team participation levels tabled below, represent achievable short-term objectives for both the controlling authority of this sport in Victoria, and the AIHL. They show that more ice centres will significantly boost participation as expected. They also show that more can be done and, indeed needs to be done, to realise the full potential of the service catchments of existing centres like Oakleigh and Bendigo. Network expansion is difficult to justify when existing centres are not operating at their potential. Similarly, funding for new centres is less justifiable when their viability relies on sports that are highly specialised to start, then organised in such a manner that they achieve less than their potential. Few financiers could be convinced to take the risk that Victoria's current participation problems in sports like ice hockey won't carry-over. And, in fact, the problems are endemic to the State.
In Victoria, ice sports like hockey do not yet provide the organisational blueprint that would greatly assist advocacy and development of sustainable, high-performance ice centres. Future participation levels will continue to be influenced, for better or worse, by the controlling organisational structures, administrators and cultures of each sport. So, future centres could perform little better than existing ones. They can lose customers like any business, depending on how they are managed. Their economic viability is inextricably linked to sports that, in Victoria at least, require partnerships between amateur sporting authorities and commercial enterprises (facility owners). Success depends on the organisational and business acumen that can be extracted from that informal relationship and its people, and whether their organisational model is National enterprise, or more like a small family business that just looks after its own. In the case of ice hockey, IHA's model is the former but, at times, State (club) operations are akin to the latter. For related reasons, participation in hockey at these proposed centres could be little more than half its true potential, if they were somehow all opened today (77 vs 134 teams). And so it is true to say, that the feasibility of these proposed ice centres is also affected by the way sports such as ice hockey are organised right here and now; and more specifically, by how well they are geared to attract, develop and maintain participants from their catchments. That is obvious to prospective financiers from a prospectus and investment analysis, and it matters when they are looking to spend millions. Participation is revenue. Except that developers don't think of it quite that way. It's potential market share to them. For example, figures like these broadly tell them that an ice sports centre in NSW has a potential market share of 0.22 percent of the target population living within coo-ee of their project, compared to 0.13 percent in Victoria. Either way, that's a tiny percentage of the total sport and recreation market, which makes it even more critical that the difference in potential customers between States has almost doubled. That is a very big difference, and it can easily make or break a project; even a very good project.
Organisation of ice hockey at National-level, and at State-level in places such as NSW and Queensland, has proved to be conducive to the growth and development of successful centres such as Warners Bay. But it didn't just happen overnight. NSW established Clubs north, south, east and west of Sydney in the formative 1920s, then began rebuilding its organisation and leagues from the ground up, in the 1960s. That culminated in the current local leagues and the East Coast Super League, forerunner and nucleus of the AIHL. The Queensland skating association established its own ice centres from the early-1980s. Something similar has not yet happened in Victoria, despite its pre-eminent foundations. It has often been said in many fields of enterprise: what Melbourne invents, Sydney markets. There is a poignant lesson in that for the organisers of ice sports in Victoria today, because with organisational improvements such as even better development leagues and programs, lower participation costs and greater promotion, future ice centres in Victoria can and will be viable; eminently viable. Just how long that takes is up to the organisers of the various sports but, for example, IHV took a confident step in a good direction in 2008.
The rink shortage constrains growth and development, but it need not stop it. Yet, ice hockey in the State is actually worse-off than that. The sport is in a steady state of decline, and not at all primarily due to the rink shortage, although any one or all of these four proposed rinks will help to re-establish critical mass. It is mainly due to factors that are able to be influenced by the sport's State-level operating policies and practices, as reflected, for example, in the marked difference in participation rates at Warners Bay and Oakleigh. They each have one rink and charge the same public prices for their ice, yet Oakleigh does about half as as well from a catchment twice the size of Warners Bay. And Bendigo taps its own potential even less than that.
There is a blueprint here for four new ice centres at strategic locations, and others to follow. Rinks are actually not needed in order to establish clubs at each, and so begin the process of generating demand for a strategically decentralised ice centre network. In the interim, clubs participate at the nearest or only rink available, but they each occupy and promote the proposed heartlands of their future home ice, in a virtual world of future ice sports centres — a flame where no fire burns. A dream that future ice will follow. A will that one day finds a way. Clubs stake out territory; particularly clubs with teams such as ice hockey that potentially draw the greatest: IHV's City Flyers, Western Bombers, South-eastern Bears, Eastern Pirates. And/or their Premier league clubs. The former could still be organised by IHV centrally, but their community of interest and focus is decentralised. That can be initiated by locally-based volunteer co-ordinators working from their homes and Oakleigh or, even better, a small, occasional space in a local Council or YMCA shopfront. Councils have many sport and recreation facilities. Politicians get there messages out that way; it works. There are also inline rinks at or near each of these four locations, and TAFE colleges or University campuses at some. Eventually, regularly scheduled bus shuttles to development program sessions at Oakleigh would probably be eligible for grants and sponsorship, if there was sufficient demand. And there may well be with programs such as these. Place identity needs to be marked and reinforced in some way, so that ice sports have community focal points. Because work can then begin in each city on turning plans to reality, in partnership with local Councils, schools, universities, developers of major shopping complexes, other local organisations and businesses. Centres for ice sports, and also participants. Rink funds, but also entry-level skating programs, that demonstrate organisers can and will attract participants from each service area. Even in advance of rinks, as happened long ago in other States.
It is quite difficult for prospective supporters to meet needs that don't appear to exist at a particular place and time. Ice sports need to establish strategic centres that each become the focal point of a clear and present need in their respective communities. A virtual reality. Only one step away.
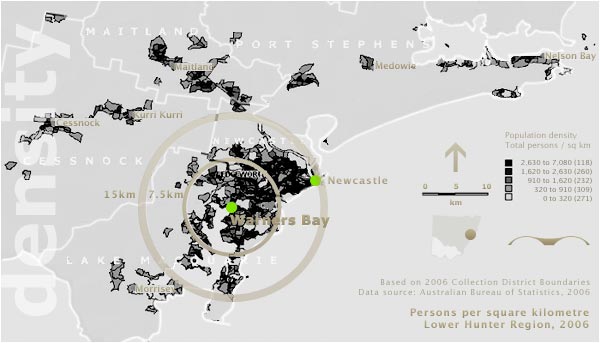
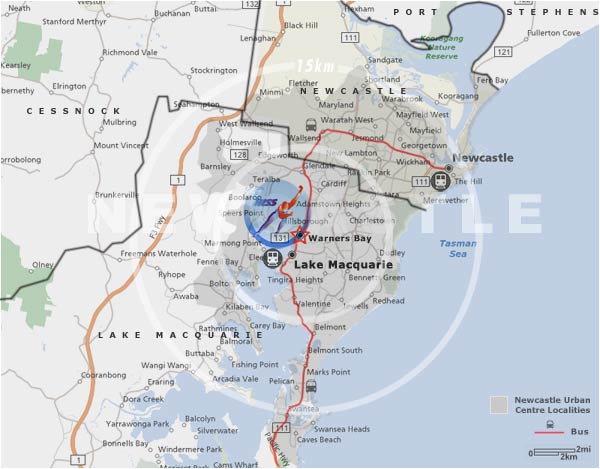
Hunter Ice Skating Stadium at Warners Bay, Newcastle, NSW, serves as a useful planning baseline. The Hunter Region extends from about 120 km to 310 km north of Sydney, with a population of about 590,000 people. It is the second most populated area in NSW and it is the hub of the Greater Newcastle area which includes most parts of the Local Government Areas of City of Newcastle, City of Lake Macquarie, City of Cessnock, City of Maitland and Port Stephens Council. There are also numerous other towns and villages scattered across the valley in the eleven Local Government Areas that occupy the region but more than half of the population live in the coastal cities of Newcastle and Lake Macquarie. Newcastle is situated 162 km NNE of Sydney, at the mouth of the Hunter River and Lake Macquarie is located 15 km from Newcastle's CBD. Newcastle has a population density of about 1,100/km2 and Lake Macquarie is about 293/km2. By comparison, Brimbank in Melbourne's western suburbs has a density of about 1,360/km2 and Greater Dandenong is about 965/km2. However, most proposed Melbourne metro core service areas average about 2,000/km2.
The Newcastle Urban Centre Localities (combined Newcastle-Lake Macquarie urban areas shaded dark inside circles on map below) have an estimated population of 288,732 (2006) which is also relatively young (about 32% under age 25). Recent strong population growth in the Newcastle city centre is generating demand for new housing and services and facilities. The average density of both cities is about 700 /km2, well below Melbourne's middle suburbs, but above some of its outer suburbs. However, the ice centre is actually perfectly located to maximise the number of people within its core and secondary catchments (map below). If it was in Newcastle itself, its catchments would be much less centralised, and most people would have to travel a lot farther. As a result, the density of the core catchment is about the same as the Melbourne metro area. The Hunter rink is located at Warners Bay, a suburb of Lake Macquarie. It's core catchment is suburban and the Newcastle urban area lies more distantly in its secondary catchment. Its extended urban catchment is around 300,000 people but there are fewer than that living in its core area, within a 7.5 km radius of the rink (circled on maps below). It is a viable centre, with a 60m by 30m IIHF-compliant rink, and although its seating capacity is less than 500, IIHF and Government grants, sponsorships and ticket sales will upgrade it to seat 1,000 with VIP/Corporate boxes, new plexiglass rink enclosure and renovated dressing rooms, for an IIHF ice hockey tournament to be held there in 2008. It is estimated that about 400 competitors and officials and several hundred supporters will visit for 7 days, injecting about $1 million into the local economy. For our purposes, the Hunter Ice Arena at Newcastle amply demonstrates a rink can be viable with a catchment of about 300,000 people, one-third of whom are under age 25, and who have reasonable access to the arena. Improvements, like better access to public transport, will further enhance rink viability because the number of prospective users will increase.
Since Warners Bay is a suburb of Newcastle (more accurately, conjoined Lake Macquarie, which is actually more populous but spread more widely) it is a useful location model for planning purposes. It is a largely self-contained regional city and so its catchment has reasonablly discernable limits, unlike Melbourne's metropolitan sprawl. When we examine it, we can be sure that the majority of its ice rink patrons come from its own catchment and socio-spatial factors influencing its success, such as age groups, are similarly contained. Alternative sport and recreation offerings there are likely to be be basically similar to many parts of the Melbourne metropolitan area. Ice sports need promotion and development at either location, but it is likely that most of Melbourne's metropolitan area has basically similar alternative offerings to Newcastle and, therefore, basically similar market competition. The population of Warners Bay is 7,009 (2006), with in excess of 615 businesses operating in two main areas. There is a variety of local businesses near the lake foreshore, such as cafes and restaurants with alfresco dining, the "Centro" shopping centre, specialty shops, boutiques and a post office. The rink is located in the second main area — a large sized industrial estate situated along Hillsborough and Macquarie roads — where there is also a ten pin bowling alley, a gymnasium and many bulk item stores including furniture stores and gardening centres. Warners Bay is home to a number of sporting clubs including the Warners Bay Bulldogs (AFL), Warners Bay Panthers (Football/Soccer) and Warners Bay/Cardiff Junior Cricket Club. A railway planned for Warners Bay was never established but the bus network radiates from a terminal near CityRail's Newcastle station, on the waterfront of Newcastle's CBD. Major interchanges are located at the University of Newcastle, Wallsend, Glendale, Warners Bay, Belmont, Charlestown, Westfield Kotara and Broadmeadow Station. To reduce journey times, bus-only lanes are in operation on certain major roads in Newcastle, which is also serviced by two CityRail lines typically providing local and regional commuter services.
|
Target population x age band
|
||||||||||||
|
|
||||||||||||
| SEIFA | State Growth Rank |
Jnr
|
Snr
|
Open
|
All
|
% Total
|
||||||
|
|
|
|
||||||||||
| Newcastle core service areas | IER | IRSD | Fastest | Largest |
Total
|
0-4
|
5–14
|
15–19
|
20-34
|
5-34
|
5-34
|
|
|
|
||||||||||||
 |
Lake Macquarie (C) - East | 1000 | 972 | 66 | 22 | 62,624 | 3,582 | 8,795 | 4,440 | 9,499 | 22,734 | 16.9% |
| Lake Macquarie (C) - North | 1000 | 972 | 66 | 22 | 75,835 | 4,712 | 10,113 | 5,378 | 14,645 | 30,136 | 22.4% | |
| Lake Macquarie (C) - West | 1000 | 972 | 66 | 22 | 53,496 | 2,949 | 7,217 | 3,732 | 8,406 | 19,355 | 14.4% | |
| Newcastle (C) - Inner City | 1066 | 1046 | 30 | 9 | 50,686 | 2,565 | 4,681 | 3,092 | 13,822 | 21,595 | 16.1% | |
| Newcastle (C) - Outer West | 952 | 968 | 30 | 9 | 44,311 | 2,858 | 5,830 | 3,317 | 9,863 | 19,010 | 14.1% | |
| Newcastle (C) - Throsby | 952 | 968 | 30 | 9 | 54,078 | 3,247 | 6,122 | 3,526 | 11,870 | 21,518 | 16.0% | |
|
|
||||||||||||
| Totals | 995av | 983av | 48av | 16av | 341,030 | 19,913 | 42,758 | 23,485 | 68,105 | 134,348 | 39.4% | |
| % of total population (15km rad) | 100% | 5.8% | 12.5% | 6.9% | 20.0% | 39.4% | ||||||
|
|
||||||||||||
| % of 5-34 population | 31.8% | 17.5% | 50.7% | 100.0% | ||||||||
The local ice hockey club in Newcastle is one of seven in the NSW network and has grown to over 300 members since the Hunter Ice Skating Stadium opened its doors. That is about equal to ice hockey player registrations throughout all metropolitan Melbourne in 2007 (315 players); a participation rate of about 2.2 players per 1,000 target population. Hunter conduct a 1-hour per week, 6-week, 3-level ice hockey development course that costs only $45.00, plus $55.00 for IHNSW insurance. They hire helmet and sticks for $3.00 at the entry level. The Hunter ice centre and its catchment tell us that a single, International-sized rink can be economically viable in an urban/suburban area with basically similar population density, access, socio-economic characteristics, market competition and management. All core catchments of the proposed main Melbourne metro locations have the same population density and target markets within their 7.5 km radii, as the Hunter Ice Stadium has within its 15 km radius. There is no question that a Melbourne metropolitan ice centre network such as that proposed here will have viable service catchments with strategically located, multiple rinks. Each location then requires a suitable site as close as possible to its public transport terminus, but no farther than about 0.4 km; one or two well-designed international-sized rinks appropriate to its planned service role; and capable centre management/ promotion. Under those conditions, each ice centre will be able to develop and sustain its own local skating programs, ice sports leagues and at least one AIHL team, as presently occurs at Hunter Ice Skating Stadium.
The Melbourne Park precinct including Yarra Park is run by the Melbourne and Olympic Parks Trust (MOPT). Until last year (2007), the land was controlled by a range of bodies including the council, VicTrack, and several government departments. The Melbourne and Olympic Parks Amendment Bil 2007, brought all land under the control of the trust, which reports to Sport Minister James Merlino. The Government then offered leases of a minimum 21 years to the Demons AFL club, Victory A-League soccer club and Storm NRL club, who could previously only secure 3-year leases from the Council to train on Gosch's Paddock. The Government proclaimed parts of the land adjoining Gosch's Paddock as public open space, to offset the lengthy leases.
Historically, most current uses were established on former playing fields like Vodafone Arena on the Old Xavierians Oval. The State Government now has control over the future planning of the precinct and its remaining site opportunities. A $2 million Government business study due at the end of 2008, will report on a new stadium and other improvements aimed at securing the tennis Open after 2016. There are opportunities for ice sports with flow-on benefits to existing users. If Melbourne is ever to replace it's International rink — historically, ideally and sensibly, it belongs somewhere here. The timing is similar to the prelude to the Vodafone Arena opening in 2001, when Victorian cycling finally succeeded in securing world-class facilities in a multi-purpose facility, almost 30 years after the Melbourne Olympic Velodrome was demolished in 1972. Melbourne lost its original International rink in 1957 and St Moritz at St Kilda in 1981.
New facility proposals must obviously be explored with the State government and controlling authorities to plan and avoid displacement of existing uses, but a new ice arena will provide additional facilities for use by others during their major events, and changeover from ice to a timber floor can take as little as 3 hours using call-in workers; less to pull up. This location is close to the former Glaciarium Ltd International rink, 'The Academy of Ice Skating', established 1906 as 3rd largest in the world; closed 1957; building destroyed 1964. It was located just across Princes Bridge on City Road, where the South Gate commercial towers now stand (1 on map below), and was home to the basketball and gymastics competitions of the 1956 Olympics centred at adjacent Olympic Park. Possible sites include: (1) the reclaimed railyards adjacent Fed Square; gateway to Melbourne Park (2 on map) with a linear scheme; (2) Old Scotch Oval, (3 on map), where temporary marquees are erected during the Tennis Open but, for example, they could also use facilities in a new rink arena during their events; (3) two possible sites on Gosch's Paddock (4 and 5 on map), now leased to rugby clubs for training, but it is possible a new rink here could enable that to continue and also provide shared training facilities and other services; and (4) the old running track, Gosch's Paddock, which would also require a linear layout (6 on map). There are no doubt other opportunities nearby and in Yarra Park. See Melbourne Ice Academy for Melbourne Park details.
The City rink could do more than has been publicly proposed in the $55 million National Ice Sports Centre at Docklands, and for less cost. In 1995 in the US, Frank Gehry designed Anaheim Ice for the NHL Ducks with twin practice rinks; one NHL-size, one Olympic-size. Gehry is one of the most respected architects in the world but with a reputation for high-cost buildings, yet Anaheim Ice only cost about US$9 million or about A$15 million on present value. That is only one-third more than the committed government NISC funds, and one-quarter its estimated cost. Gehry's original design was framed by steel to cover an 8,000 square metre area, but he changed to engineered timber laminated beams to reduce costs. The complex is clad in corrugated aluminium and the ceilings are plywood. The arched timber beams are 0.22m by 1.292m in section, spaced at 6.7m on centre and span 35.4m. Gehry's complex is about one-eighth the size of the Air Canada Centre, but it was about one-twentieth the cost to construct and its building structure and fabric reduce running costs and will outlast most of its contemporaries. It did not have the huge construction and ongoing operating economies of scale of Air Canada, yet it only cost about $1,875 per square metre. By comparison, a quality home in Melbourne cost upwards of $2,000 per square metre. Architect-designed homes are typically even higher cost and quality, and Gehry's homes are commonly two or three times that and sometimes much more. Anaheim Ice also hosts local youth hockey, figure skating events, and public skating. It contains a restaurant and spaces for community events and, on top of that, it was conceived as a pilot project for a Disney program with a serious social mission. Directed by David Wilk, founder of a pioneering New York City program called 'Figure Skating in Harlem', the 'Disney Goals' program is being developed to serve inner-city youth. Wilk views skating as a way to develop teamwork, discipline and self-esteem. In addition to recreation, 'Goals' offers scholarships, internships and other educational programs. Disney planned to replicate it in other American cities using Gehry's Anaheim rink concept, modified to suit each new city context. The Disney rinks succeed as commercial ventures, but they are not about consumption, tourism or passive entertainment. They're designed to engage individuals and communities in the pursuit of their own dreams.
Isn't that what Melbourne needs? Yes. But it won't work alone. Create and keep it small and local. Brand it uniquely Melbourne. But selectively market it global. Keep it simple and boost it with basic but essential facilities for in-residence ice sports training and development. Think International, not just local or National. Get some paying partners, but don't hock the soul of local ice sports. Locate at or next to Melbourne and Olympic Parks where like-minded 'shoppers' pass your 'store'. Where there is already a range of related world-class facilities with about two million patrons and a wide variety of commercial opportunities from sponsorship, film shoots, supply rights, signage and superbox leasing. Determine the other income-generators according to what is already there. Measure costs and projected incomes precisely and least optimistically. Melbourne has lost most of its rinks, its athletes, its enthusiasts. But, fortunately, it is still Melbourne and there, anything is possible. Don't put it in a tin shed; it will collapse physically and financially, as did all those like it that came before. Until, eventually, no-one will dare touch an ice rink here. Give the operators a fighting chance with the running and replacement costs — design it to run economically, like the purpose-built Glaciarium and even St Moritz which, combined, survived 93 wonder-filled years. Don't import the North American and European ideas and architects. Import their paying ice hockey teams for a week or a month, their elite skaters and their juniors, their trainers, their patrons and coaches. In the off-season or all year round. Attract the same kind of patrons from the region; the New Zealand Federation which includes three associations; the Hong Kong Ice Hockey Association; the Ice Hockey Association of Thailand and the Asia League Ice Hockey where seven teams from Japan, China and South Korea play a 30-game schedule (official site). Japan also has College Hockey leagues. All run Development Camps. All could use a well-conceived and promoted training and development venue in a city like Melbourne, as well as Australasian contests and exchanges. Some may even be interested in becoming partners.
It is time to use the legacy Henry Newman Reid — the founder of Australian ice sports — left the city and Nation. One hundred years ago, Melbourne Glaciarium was the third-largest ice arena in the world with an international rink and seating for thousands. It employed world-famous instructors and was known as "The Academy of Ice Skating", established 1906. Melbourne should never be satisfied with being the leader in ice sports nationally. It was the cradle of Australian and regional ice sports and it enjoys loyal patronage of all things sporting from its people. Melbourne should aim to be the regional leader by providing core facilities and services for its kids, and selectively hiring them to the region, to the world. That will help rink viability, but it will also produce synergies and spin-offs that will reward in more ways than money. Melbourne should aim to cater for its kids to train and develop at home, side-by-side with the rest of the world, in one of the world's largest sporting precincts, in one of the worlds great sporting cities, with all that the city has to offer. And slowly re-create what it had a century ago, but lost.
The core service area of an ice centre located centrally in the city is summarised in the table below, assuming no other rinks are located within its core catchment. Presently, rinks are proposed at Waterfront City, Docklands, and at St Kilda, neither of which are central. The following on-site links are to pages containing information on their status: Docklands and St Kilda Triangle. The city catchment has over 0.5 million people, almost half of whom are aged in the ice sports target range (5-34). Of them, three-quarters are in the Open age group (20-34); 14 percent Junior (5-14); and 11 percent Senior (15-19). There is probably sufficient population to support two or three well-promoted rinks catering to recreational skating and Open age ice sports (20-34yrs). However, the urban catchment contains about the same number of people in Junior and Senior age bands as each suburban catchment (more obvious in the summary table of the preceeding section). They can be served from one rink; indeed, two or more rinks in this catchment would compete for the same Under 20 sports market segment. All things being equal, the lowest-priced rink would have the market advantage, and the other would be proportionately less viable, unless it had other market opportunities. That is likely since at least one City rink will operate at Service Level 1. It is not yet known if St Kilda will cater for organised ice sports but, for example, it could service the local Under 20 market segment if it had an international-sized rink, and the NISC could service the more specialised segments as intended, such as AIHL. Both rinks would then have sufficient patronage to be viable. As noted in the Introduction, the main urban rink should be located on the eastern side of the CBD, where the majority of the greater metropolitan area population resides, to avoid unecessarily drawing potential users through the inner city to the west; to benefit from and supplement the critical mass of sports facilities and services already there; and to preserve the service catchment of the best location for a future Western Suburbs ice centre (see below).
| Target population x age band | ||||||||||||
|
|
||||||||||||
| SEIFA | State Growth Rank | Jnr | Snr | Open | All | % Total | ||||||
|
|
|
|
||||||||||
| City core service areas | IER | IRSD | Fastest | Largest | Total | 0-4 | 5–14 | 15–19 | 20-34 | 5-34 | 5-34 | |
|
|
||||||||||||
|
Glen Eira (C) - Caulfield | 1016 | 1091 | 27 | 14 | 80,091 | 4,789 | 8,020 | 4,253 | 20,601 | 32,874 | 13.3% |
| Melbourne (C) - Remainder | 942 | 1079 | 2 | 4 | 49,756 | 1,607 | 2,125 | 4,578 | 23,971 | 30,674 | 12.4% | |
| Yarra (C) - North | 969 | 1101 | 16 | 24 | 47,280 | 2,382 | 2,993 | 1,710 | 17,991 | 22,694 | 9.2% | |
| Port Phillip (C) - St Kilda | 945 | 1094 | 9 | 9 | 47,280 | 2,382 | 2,993 | 1,710 | 17,991 | 22,694 | 9.2% | |
| Stonnington (C) - Prahran | 1002 | 1118 | 23 | 19 | 48,379 | 1,826 | 2,596 | 1,844 | 17,853 | 22,293 | 9.0% | |
| Moreland (C) - Brunswick | 916 | 1022 | 29 | 18 | 43,697 | 2,107 | 2,893 | 1,817 | 16,562 | 21,272 | 8.6% | |
| Darebin (C) - Northcote | 1050 | 1036 | 29 | 17 | 48,311 | 3,238 | 4,248 | 1,930 | 13,733 | 19,911 | 8.0% | |
| Boroondara (C) - Hawthorn | 1012 | 1118 | 39 | 20 | 35,466 | 1,799 | 3,004 | 2,104 | 12,530 | 17,638 | 7.1% | |
| Yarra (C) - Richmond | 881 | 1075 | 16 | 24 | 26,221 | 1,202 | 1,452 | 938 | 10,851 | 13,241 | 5.4% | |
| Port Phillip (C) - West | 968 | 1101 | 9 | 9 | 26,221 | 1,202 | 1,452 | 938 | 10,851 | 13,241 | 5.4% | |
| Boroondara (C) - Kew | 1018 | 1128 | 39 | 20 | 30,477 | 1,614 | 3,545 | 2,134 | 6,555 | 12,234 | 4.9% | |
| Melbourne (C) - S'bank-D'lands | 908 | 1117 | 2 | 4 | 14,223 | 260 | 304 | 930 | 8,205 | 9,439 | 3.8% | |
| Melbourne (C) - Inner | 937 | 1018 | 2 | 4 | 12,699 | 175 | 155 | 1,296 | 7,770 | 9,221 | 3.7% | |
|
|
||||||||||||
| Totals | 966av | 1081av | 19av | 14av | 510,101 | 24,583 | 35,780 | 26,182 | 185,464 | 247,426 | 48.5% | |
| % of total population | 100% | 4.8% | 7.0% | 5.1% | 36.4% | 48.5% | ||||||
|
|
||||||||||||
| % of 5-34 population | 14.5% | 10.6% | 75.0% | 100.0% | ||||||||
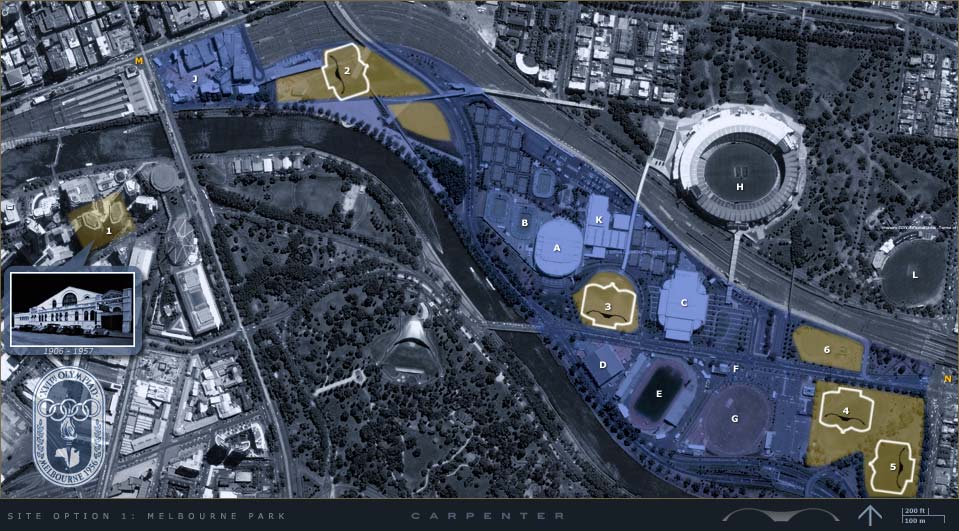
Melbourne Park Possible Site Options 1-6 worthy of consideration. Existing facilities: [A] Rod Laver Arena [B] Margaret Court Arena [C] Vodafone Arena (former Old Xavierians Oval). Designed for major ice events seating many thousands [D] Lexus Centre, former 'Glasshouse' and Melbourne Olympic Pool [E] Olympic Park Stadium [F] Sports Medicine Centre [G] New Rectangular Stadium (Rugby/ Soccer), Edwin Flack Field [H] MCG in Yarra Park [J] Federation Square [K] Melbourne Park Function Centre [L] Punt Road Oval in Yarra Park [M] Flinders Street Station [N] Richmond Station
The South Oakleigh Olympic Ice Skating Arena (Long & Argue) opened on Centre Road in 1971, following closure of the short-lived Moorabbin rink (Burley:1966-70) located nearby on the corner of South and Warrigal Roads. No doubt the operators were able to acquire some of the patronage established by Moorabbin. Like Moorabbin, which started the spate of 'tin-shed' rinks, Oakleigh was not purpose-designed and nor were any of the six rinks that were to follow. It was Melbourne's fourth rink and it is now the only rink in Victoria still operating. Although it seats about 500 people, the ice floor at two-thirds minimum IIHF size (52m by 21m), is too small for International- or even National-standard competition and, 37 years on, it is run-down, inefficient and costly to use. The building is neither insulated nor airtight; melts are not uncommon; and rink markings routinely disintegrate early in the season because the ice pad is not properly prepared and has no thermal buffer. Skates have severed pipes. It has operated for the past 3 years without market competition. The better, international-size rinks in SA, WA and Queensland, and half the rinks in NSW, are less expensive to use than Oakleigh, where children are charged adult prices. Like Oakleigh, some of the larger NSW and Queensland rinks have been operating for up to 35 years.
On most measures, Oakleigh is among the most-expensive rinks in the country, yet it is seriously under-sized by one-third; it is often overcrowded; and the comparatively few amenities it has are neglected to avoid costs. The building is not non-airtight, uninsulated, non-compliant in terms of fire safety and emergency escape, and not environmentally controlled. Ice-related running costs are one-third the norm and environmental control plant and energy costs are almost zero. That led to a corroded roof that was recently replaced through necessity; the only capital improvement to the building over many years. The re-roofing costs were avoidable and could have been invested earlier and more wisely to provide condensation control and comfort conditions. Amazingly, the roof was re-installed without insulation in the mistaken belief that would save a few thousand dollars. The ice floor quality is poor, sometimes dangerous. It is not workable for curling.
The core catchment of the Oakleigh rink includes most of Glen Eira (pop. 130,000), Monash (pop. 170,000), Bayside (pop. 92,000), Kingston (pop. 140,000) and part of Stonnington. Average household incomes in the catchment are much higher than the Melbourne average. Since Oakleigh is the only rink remaining in the State, it presently draws from as far afield as Berwick and Greensborough. Needless to say, available ice time is fully booked, often until very late in the evenings. By default, Oakleigh presently has a monopoly on Melbourne ice to the extent that it cannot service demand. The lack of maintenance and improvements suggests even its owners consider its long-term future to be bleak. In the meantime, it is operated as a cash cow.
| Target population x age band | ||||||||||||
|
|
||||||||||||
| SEIFA | State Growth Rank | Jnr | Snr | Open | All | % Total | ||||||
|
|
|
|
||||||||||
| Oakleigh core service areas | IER | IRSD | Fastest | Largest | Total | 0-4 | 5–14 | 15–19 | 20-34 | 5-34 | 5-34 | |
|
|
||||||||||||
 |
Kingston (C) - North | 922 | 1039 | 29 | 16 | 93,111 | 5,419 | 10,347 | 5,722 | 19,500 | 35,569 | 6.0% |
| Glen Eira (C) - Caulfield* | 1016 | 1091 | 27 | 14 | 80,091 | 4,789 | 8,020 | 4,253 | 20,601 | 32,874 | 5.6% | |
| Bayside - Brighton/South* | 1060 | 1127 | 39 | 27 | 91,726 | 5,785 | 11,708 | 5,950 | 13,592 | 31,250 | 5.3% | |
| Monash (C) - Waverley West | 939 | 1075 | 34 | 12 | 65,570 | 3,243 | 7,107 | 4,587 | 13,355 | 25,049 | 4.3% | |
| Gr. Dandenong (C) - Dandenong | 926 | 904 | 52 | 30 | 57,317 | 3,591 | 7,015 | 3,986 | 13,233 | 24,234 | 4.1% | |
| Monash (C) - Waverley East | 911 | 1072 | 34 | 12 | 58,824 | 2,636 | 6,613 | 4,199 | 11,271 | 22,083 | 3.8% | |
| Monash (C) - South-West | 886 | 1004 | 27 | 14 | 45,435 | 2,504 | 3,971 | 2,911 | 14,973 | 21,855 | 3.7% | |
| Stonnington (C) - Malvern* | 962 | 1123 | 23 | 19 | 46,856 | 2,777 | 5,225 | 2,924 | 11,384 | 19,533 | 3.3% | |
| Glen Eira (C) - South | 1150 | 1075 | 27 | 14 | 49,485 | 3,241 | 6,217 | 3,029 | 8,769 | 18,015 | 3.1% | |
|
|
||||||||||||
| Totals — 2008 | 975av | 1067av | 33av | 17av | 588,415 | 33,985 | 66,223 | 37,561 | 126,678 | 230,462 | 39.2% | |
| % of total population | 100% | 5.8% | 11.3% | 6.4% | 21.5% | 39.2% | ||||||
|
|
||||||||||||
| % of 5-34 population | 28.7% | 16.3% | 55.0% | 100.0% | ||||||||
|
|
||||||||||||
| Totals — post-St Kilda [less*] | 956av | 1054av | 40av | 16av | 400,348 | 22,182 | 43,073 | 25,658 | 92,933 | 161,664 | 27.5% | |
| % of total population | 68.0% | 3.8% | 7.3% | 4.4% | 15.8% | 27.5% | ||||||
|
|
||||||||||||
| % of 5-34 population | 18.7% | 11.1% | 40.3% | 70.1% | ||||||||
A rink at this location does not significantly affect the strategy for future metropolitan rinks unless one is located at Dandenong, rather than Narre Warren as recommended. However, a multi-rink network will affect Oakleigh. Its facilities can only support Level 3 services but it presently operates at a higher level because there is no alternative venue. Its service role will downgrade accordingly when a better facility is available because of its limited access, facilities and under-sized rink. The proposed rink approved in the St Kilda Triangle development will also overlap about one-third of the core service catchment of Oakleigh. It is not yet known whether the service role of St Kilda will be recreational skating only, or whether it will also provide for ice sports. Either way, Oakleigh will be more or less impacted because large parts of Glen Eira (pop. 95,000), Bayside (pop. 92,000) and some of Stonnington (pop. 57,000) will use the St Kilda rink, depending on its offerings. Its core catchment will still be viable but more typical of the rest of the network plan, reducing to around 400,000; perhaps more, depending on the attractiveness of St Kilda facilities. Oakleigh cannot be expanded without acquiring one of two adjacent sites, and it will almost certainly lose further patronage when multiple metropolitan rinks are established, at least for a short term. Surrounded by affluent suburbs with low running costs and little or no debt service, it may survive price competition, but the site has poor public transport access (buses only), and it will always be limited by size and site constraints. Therefore, it cannot be competitive in a future multi-rink heirarchy unless it expands, and the cost of doing that could prove to be similar to the cost of establishing at a site better served by public transport, to improve its market competitiveness. Without that, Oakleigh will need to establish a market niche in order to survive, even without overlapping core catchments. Its niche opportunities will eventually become limited to recreational skating/sports and some athlete development and training.
Springvale, 25 km south-east of Melbourne CBD and 8 km from Dandenong, is a more strategic location in the same corridor, if a south-eastern ice centre is located at Narre Warren, not Dandenong. Springvale has two train stations, good bus services, and it is linked to Melbourne's CBD by Monash Freeway, via the Jacksons Road exit to the suburb's northeast. It also now has reasonable acces to Eastlink, linking Ringwood and Frankston. Springvale has an International Motor raceway and Greyhound Racing Track.
Olympic Ice Rink at Oakleigh South, 2007, photographed over a car roof by Zero G. Photo-manipulated, but it does look better.
There is strong interest in ice sports in the west. A rink operated from Footscray (Burley) for seven years between 1979-86. It was the first and only rink in the western suburbs until it was sold and later burnt down, like South Gate and St Kilda before it. The original government feasibility study for the ice sports centre (Marriott:Jan 2001) cited proposals from Ballarat Council jointly with the local YMCA, and Maribynong Council jointly with Victoria University. Today, a suburban rink for the west is likely to be most viable strategically located on the fork of the Melton and Sunbury metro-regional rail lines at Sunshine, perhaps at or near Victoria University or one of two sub-regional shopping centres there. The core catchment reduces farther out toward Watergardens (Sydenham) and Deer Park, and the travel time savings from regional stations that would benefit is only 10 minutes or less (timetables). Ballarat-line passengers can alight at Sunshine (1 hr from Ballarat, every hour) and Bendigo-line passengers can alight there on peak services or connect from Watergardens, each hour on weekends. The outlying growth areas of Melton (pop. 35,000) and Sunbury (pop. 31,000) are within 20-minute rail access of Sunshine. It is located in the City of Brimbank and was formed out of the former cities of Keilor and Sunshine. It is the second largest local government area in metropolitan Melbourne with a population of 168,215 (2006). The core catchment of a rink at this location will also include Maribyrnong (pop. 66,150), Moonee Valley (pop. 111,500) and most of Hobsons Bay (pop. 84,000), giving it a core total in excess of 300,000 people. The Sunshine ice centre should have in-residence accommodation facilities (eg., Bendigo) to help reduce the cost of regional participation. Sunshine Roller Skating Centre is located at 38 McIntyre Road, Sunshine opposite the Westend Market (black diamond, map opposite), and has general skating and inline/roller hockey.
The NISC site currently proposed on Footscray's eastern border would overlap up to half the core catchment of a Sunshine rink, leaving the other half under-serviced and less accessible, because a second rink in the west would probably not be viable for many years thereafter. Overlaps like that are particularly costly with ice rinks because they are highly-specialised and therefore often only marginally economic, or uneconomic if poorly planned and designed. The main urban rink should be located centrally such that it preserves the location that best serves both the western suburbs and the growth areas beyond. Docklands boasts an estimated resident population of 20,000 people in 2020 but, even if that eventuates, it would be equally well served by ice facilities at or near Melbourne Park. Over three times that number live at Sunbury and Melton right now and, like most people in the western suburbs, they can access Sunshine much quicker and easier than the Moonee Ponds Creek. The Docklands site became even less viable following the announcement of the St Kilda Triangle rink proposed to be located in the City of Port Phillip where Australian ice sports started. It will be located in a traditional and unique entertainment precinct with better tram access than Docklands. Route 16 takes about 20 minutes from Flinders St Station to the Esplanade Hotel (Stop 135), opposite the Triangle. The St Kilda core service catchment will overlap more than one-third of the core catchment of the proposed Docklands rink, but it is assumed that their service roles will be sufficiently diversified to ensure both are viable (see City location above).
| Target population x age band | ||||||||||||
|
|
||||||||||||
| SEIFA | State Growth Rank | Jnr | Snr | Open | All | % Total | ||||||
|
|
|
|
||||||||||
| Western core service areas | IER | IRSD | Fastest | Largest | Total | 0-4 | 5–14 | 15–19 | 20-34 | 5-34 | 5-34 | |
|
|
||||||||||||
 |
Brimbank (C) - Keilor | 988 | 980 | 34 | 13 | 90,710 | 5,837 | 13,267 | 7,218 | 19,969 | 40,454 | 10.6% |
| Brimbank (C) - Sunshine | 934 | 868 | 34 | 13 | 84,036 | 5,377 | 10,813 | 5,614 | 20,164 | 36,591 | 9.5% | |
| Moonee Valley (C) - Essendon | 888 | 1074 | 57 | 48 | 69,893 | 4,209 | 7,843 | 4,182 | 17,428 | 29,453 | 7.7% | |
| Maribyrnong (C) | 917 | 940 | 13 | 22 | 66,145 | 4,273 | 6,304 | 3,339 | 19,803 | 29,446 | 7.7% | |
| Moonee Valley (C) - West | 888 | 1023 | 57 | 48 | 41,660 | 2,162 | 4,455 | 2,475 | 8,334 | 15,264 | 4.0% | |
| Hobsons Bay (C) - Williamstown | 982 | 1048 | 52 | 41 | 30,741 | 2,187 | 3,839 | 1,681 | 6,068 | 11,588 | 3.0% | |
|
|
||||||||||||
| Totals | 933av | 988av | 41av | 31av | 383,185 | 24,045 | 46,521 | 24,509 | 91,766 | 162,796 | 42.5% | |
| % of total population | 100% | 6.3% | 12.1% | 6.4% | 23.9% | 42.5% | ||||||
|
|
||||||||||||
| % of 5-34 population | 28.6% | 15.1% | 56.4% | 100.0% | ||||||||
The City of Greater Dandenong has an area of 130 square kilometres and a population of 125,500 (2006), formed by the merger of parts of the former City of Dandenong and City of Springvale in 1994. A full-size rink operated between 1977-87 on the South Gippsland Highway, some distance from Dandenong CBD and remote from public transport. It was opened by Don Gallagher six years after Oakleigh (Long & Argue) opened and then later sold to the Burley family. The catchment areas of both rinks overlapped. Dandenong was a bigger rink but with higher operating costs. Both had access difficulties. Between 1966-70, the Burleys had operated a small rink (36m by 18m) at Moorabbin, on the corner of South and Warrigal Roads, very near to the Oakleigh rink. Oakleigh opened the year after Moorabbin closed.
Dandenong Skate Centre inline skating rink at 41 Princes Highway has general and artistic skating and inline hockey. Dandenong Rangers compete in the WNBL and play home games at the Dandenong Basketball Stadium near the corner of Heatherton and Stud Roads. Dandenong is on the junction of the Cranbourne and Pakenham rail lines and it is therefore probably the most strategic location for a rink in the south-east. However, close proximity of the existing Oakleigh rink may affect both catchments and suitable sites within 0.5 km of the railway station may not be available. If Oakleigh closed and was not replaced, Dandenong would be preferable. Otherwise, Narre Warren would be a good alternative, roughly midway between Pakenham (Bairnsdale regional service) and Dandenong. On balance, although Narre Warren cannot serve the Cranbourne rail line, it is probably a better longer-term strategy because of rapid development in the corridor.
Over the years Narre Warren has grown from a semi-rural residential town to become a part of a major growth corridor in the south-east of Melbourne, located 42 km (26 mi) from Melbourne 11 km (7 mi) from Dandenong. In recent years, it has expanded through a multitude of new housing developments to now adjoin neighbouring suburbs such as Berwick and Cranbourne. An estimated eight houses are built every day in the area with young, middle-class families representing the majority of new residents. The core catchment of a rink in this location will also include a significant proportion of Greater Dandenong (pop. 125,500), Yarra Ranges (pop. 145,000) and Cardinia (57,000) and have regional drawing power along the Bairnsdale rail corridor.
![]()
| Target population x age band | ||||||||||||
|
|
||||||||||||
| SEIFA | State Growth Rank | Jnr | Snr | Open | All | % Total | ||||||
|
|
|
|
||||||||||
| South-eastern core service areas | IER | IRSD | Fastest | Largest | Total | 0-4 | 5–14 | 15–19 | 20-34 | 5-34 | 5-34 | |
|
|
||||||||||||
 |
Casey (C) - Berwick | 974 | 1044 | 5 | 1 | 90,571 | 7,643 | 15,821 | 6,470 | 19,956 | 42,247 | 13.6% |
| Casey (C) - Cranbourne | 1146 | 953 | 5 | 1 | 65,955 | 5,467 | 10,805 | 4,797 | 15,884 | 31,486 | 10.1% | |
| Gr. Dandenong (C) Bal | 1055 | 865 | 52 | 30 | 73,434 | 4,519 | 9,283 | 4,668 | 16,844 | 30,795 | 9.9% | |
| Casey (C) - Hallam | 1158 | 976 | 5 | 1 | 51,860 | 3,189 | 7,530 | 4,388 | 10,997 | 22,915 | 7.4% | |
| Cardinia (S) - Pakenham | 1053 | 998 | 4 | 6 | 28,413 | 2,453 | 4,788 | 1,949 | 6,308 | 13,045 | 4.2% | |
|
|
||||||||||||
| Totals | 1077av | 967av | 14av | 8av | 310,233 | 23,271 | 48,227 | 22,272 | 69,989 | 140,488 | 45.3% | |
| % of total population | 100% | 7.5% | 15.5% | 7.2% | 22.6% | 45.3% | ||||||
|
|
||||||||||||
| % of 5-34 population | 34.3% | 15.9% | 49.8% | 100.0% | ||||||||
Ringwood is 27 km (17 mi) from Melbourne and its centre is based on Maroondah Hwy (the continuation of Whitehorse Road from Blackburn), which is mainly a peripheral retail area (homewares and furniture) making up the Nunawading Mega Mile. Its main core retail facility is the Eastland Shopping Centre, which is close to Ringwood railway station, located on the other side of the road from the centre. The City of Maroondah was created through the combination of the Cities of Ringwood and Croydon, along with other smaller suburbs, in December 1994, and has a population of 99,200 (2006). This location will also service the larger portions of Manningham (pop. 115,700), Knox (pop. 152,500) and Whitehorse (pop. 145,000), providing a generous core catchment area. It will also draw from the Belgrave and Lilydale rail corridors. As part of the Melbourne 2030 planning policy, Ringwood became a designated 'Transit City' in a push to locate higher-density development near public transport facilities. Ringwood railway station is an interchange for the Belgrave and Lilydale lines, and therefore the strategic location for an ice centre in this corridor. In 2008, Ringwood will also be served by Eastlink, a new tollway in the eastern suburbs connecting with the Eastern freeway and linking Ringwood to Dandenong and Frankston.
A 56m by 26m rink operated at 28 -30 Maroondah Highway (black star; image left) between 1971-82 (Iceland:Burley) and later between 1994-2003 (Lalik). The site was very well located but the facility did not have spectator seating. Ringwood is ranked fifth for ice facilities behind South Gate, St Kilda, Oakleigh and Bendigo, having successfully operated a rink in the same location for 20 years, up until five years ago. Suitable sites will be available within walking distance of the station in the "Mega Mile" where peripheral retailing has traditionally operated from larger building parcels. Roller City Bayswater at 37 Scoresby Road (near Bayswater Station, two stops from Ringwood) has general, speed and artistic roller skating and inline hockey.
![]()
| Target population x age band | ||||||||||||
|
|
||||||||||||
| SEIFA | State Growth Rank | Jnr | Snr | Open | All | % Total | ||||||
|
|
|
|
||||||||||
| Eastern core service areas | IER | IRSD | Fastest | Largest | Total | 0-4 | 5–14 | 15–19 | 20-34 | 5-34 | 5-34 | |
|
|
||||||||||||
 |
Knox (C) - North-East | 943 | 1031 | 38 | 21 | 64,256 | 3,857 | 8,024 | 4,353 | 13,896 | 26,273 | 8.0% |
| Maroondah (C) - Croydon | 896 | 1051 | 46 | 32 | 59,640 | 3,869 | 8,402 | 4,316 | 12,008 | 24,726 | 7.6% | |
| Knox (C) - North-West | 943 | 1031 | 38 | 21 | 46,463 | 2,317 | 5,932 | 3,990 | 9,380 | 19,302 | 5.9% | |
| Whitehorse (C) - Nunawading W. | 948 | 1072 | 39 | 25 | 51,731 | 3,290 | 5,825 | 2,786 | 10,219 | 18,830 | 5.8% | |
| Whitehorse (C) - Nunawading E. | 930 | 1072 | 39 | 25 | 46,006 | 2,890 | 5,143 | 2,737 | 9,594 | 17,474 | 5.3% | |
| Maroondah (C) - Ringwood | 1010 | 1061 | 46 | 32 | 42,838 | 2,614 | 4,912 | 2,700 | 9,001 | 16,613 | 5.1% | |
| Manningham (C) - East | 940 | 1126 | 52 | 40 | 15,695 | 880 | 2,603 | 1,503 | 2,216 | 6,322 | 1.9% | |
|
|
||||||||||||
| Totals | 944av | 1063av | 46av | 28av | 326,629 | 19,717 | 40,841 | 22,385 | 66,314 | 129,540 | 39.7% | |
| % of total population | 100% | 6.0% | 12.5% | 6.9% | 20.3% | 39.7% | ||||||
|
|
||||||||||||
| % of 5-34 population | 31.5% | 17.3% | 51.2% | 100.0% | ||||||||
The present City of Frankston was created in 1994 out of the remains of three abolished councils—all but the suburb of Mount Eliza from the former City of Frankston; the suburbs of Carrum Downs, Langwarrin and Skye from the City of Cranbourne; and part of Carrum Downs from the City of Springvale. In 1982, it became a sister city of Susono, in Shizuoka, Japan. Frankston has an area of 131 square kilometres and a population of 117,801 (2006), a density of 899/km2. It is projected to increase to 133,609 people by 2030 (less than State average) with a doubling in the age band over 60 (like many places in Victoria). There are limited opportunities for new housing. The City is located on the eastern shores of Port Phillip, and is bounded on the north by the City of Kingston and the City of Greater Dandenong, on the east by the City of Casey, and on the south by the Shire of Mornington Peninsula. The boundaries of the City are defined largely on the north by the Eel Race Drain and Thompsons Road, on the east by the Dandenong-Hastings Road, and on the south by a complex boundary featuring Baxter-Tooradin Road, Golf Links Road and Humphries Road. Major institutions include Monash University, Frankston College of TAFE and the Frankston Campus of Mornington Peninsula Hospital. Major transport routes include the Mornington Peninsula Freeway and Frankston Freeway, the City is also served by the Frankston railway line. Frankston is the major employment and retail centre for the Peninsula Region and supports a high proportion of ‘blue collar’ workers such as tradespersons and clerical workers and a low proportion of professionals in comparison to metropolitan Melbourne.
To the south of Frankston, the adjoining Mornington Peninsula Shire has an area of 723 square kilometres and a population of 136,482 (2006); a density of 189/km2 which increases by up to 30% in summer (41,000 people). Mornington Peninsula is a tourist region with a variety of beaches (both sheltered and open-sea) and seaside resorts, much of which is now regarded as a part of greater Melbourne. It is diverse in terms of land use and economic base with a mixture of urban areas, resort towns, tourist developments, rural land and parkland. The earliest settlements serviced the surrounding rural districts, but proximity to Melbourne and the coastal environment quickly made tourism and retirement key drivers in local residential development, forming a contiguous urban area along most of the Port Phillip coast. The expansion of the Melbourne metropolitan area into the northern areas of the Shire has given areas such as Mt Eliza and Somerville characteristics of 'dormitory suburbs', with most people working in other areas to the north, such as Frankston and Dandenong. Significant industrial expansion after the Second World War in the east of the Shire (around Hastings and Crib Point) was a further impetus to residential development, while improved road transport access (notably the Mornington Peninsula Freeway) improved residents' access to work in areas to the north and stimulated growth across the municiaplity including in rural areas, such as Red Hill. These influences have continued.
The Peninsula is important in providing new residential opportunities for suburban expansion in the southern suburbs of Melbourne (especially ex-Frankston and Frankston South), and as a retirement destination for Melburnians. The flow of empty-nesters and retirees should also continue from the eastern and south-eastern suburbs, especially as the population of Melbourne ages. The attraction of the inner suburbs of Melbourne for tertiary education, employment opportunities and the 'bright lights' will also result in out-migration of some young adults in their late teens and twenties, which has implications for ice sports. However, with the varied development phases, overall size and the differing local economies, some places have developed specific roles in the housing market. Some such as Mt Eliza and Red Hill attract mature families looking to upgrade to their second and third home and, in the case of Red Hill, to a rural environment. Others such as Somerville and Mornington East tend to appeal to young and mature families, while Hastings and Crib Point provide more affordable housing options. Areas in the south are more focused as locations for retirement, and many have holiday homes as a significant share of their stock (Sorrento, Rosebud and Rye).
This variety of function and role of the small areas means that population outcomes differ significantly across the Peninsula. There are also significant differences in the supply of residential property which will also have a major influence in structuring different population and household futures over the next five to fifteen years. There are significant new 'greenfield' opportunities at Mornington East, Somerville, Rosebud, Bitttern, Hastings, Mount Martha and Safety Beach, and substantial new residential opportunities through development of vacant lots across the entire municipality. Mt Eliza and Mornington can expect a greater share of their development through more intensive use of residential land. The southern areas can also expect a significant number of new households as a result of conversion of holiday homes to permanent settlement. This pattern is likely to be uneven with areas along the Port Phillip coast more affected by the trend, than those along the southern coastal strip (Somers, Point Leo, Flinders etc.).
The Southern core service area excludes most of the Peninsula and contains about 171,000 people, 41 percent of whom are in the target age bands. That is about 55 percent of the size of the South Eastern Core (Narre Warren), but much bigger and denser than Victoria's Regional centres. Other differences to the Regional centres like Bendigo are a faster and larger growth rate and a more viable secondary catchment (three quarters of the core size in the target age band). Frankston does not have the compactness and density of the main suburban service areas, but it is compares favourably with the Newcastle locality model. An ice centre here can be viable, and it will also benefit from the 30 percent increase in patronage with the summer influx of holiday-makers. Frankston or the Peninsular have never had an ice rink. The nearest was on the South Gippsland Highway at Dandenong between 1977-87 (Gallagher). Peninsula Skateworld at 3/2 Amayla Crescent, Carrum Downs, conducts general, inline and artistic skating.
| Target population x age band | ||||||||||||
|
|
||||||||||||
| SEIFA | State Growth Rank | Jnr | Snr | Open | All | % Total | ||||||
|
|
|
|
||||||||||
| Southern core service areas | IER | IRSD | Fastest | Largest | Total | 0-4 | 5–14 | 15–19 | 20-34 | 5-34 | 5-34 | |
|
|
||||||||||||
 |
Frankston (C) - West | 1192 | 981 | 16 | 11 | 76,552 | 4,247 | 9,186 | 5,266 | 15,299 | 29,751 | 42.3% |
| Frankston (C) - East | 1026 | 1008 | 16 | 11 | 45,035 | 3,534 | 7,604 | 3,265 | 9,651 | 20,520 | 29.1% | |
| Mornington P'sula (S) - East | 902 | 1021 | 18 | 10 | 37,740 | 2,428 | 5,619 | 3,253 | 6,839 | 15,711 | 22.3% | |
| Kingston (C) - South (Carrum, Bonbeach) | 963 | 1037 | 29 | 16 | 11,717 | 756 | 1,433 | 689 | 2,308 | 4,430 | 6.3% | |
|
|
||||||||||||
| Totals - Core Service Area | 1021av | 1012av | 20av | 12av | 171,044 | 10,965 | 23,842 | 12,473 | 34,097 | 70,412 | 41.2% | |
| % of total population | 100% | 6.4% | 13.9% | 7.3% | 19.9% | 41.2% | ||||||
|
|
||||||||||||
| % of 5-34 population | 33.9% | 17.7% | 48.4% | 100.0% | ||||||||
|
|
||||||||||||
| Mornington P'sula (S) - West | 945 | 1081 | 18 | 10 | 54,615 | 3,744 | 7,486 | 3,753 | 7,972 | 19,211 | 36.8% | |
| Mornington P'sula (S) - South | 979 | 998 | 18 | 10 | 48,494 | 2,440 | 5,142 | 2,639 | 6,289 | 14,070 | 26.9% | |
| Kingston (C) - South (balance) | 963 | 1037 | 29 | 16 | 35,150 | 2,150 | 4,299 | 2,068 | 6,924 | 13,291 | 25.4% | |
| Casey (C) - South | 1152 | 1028 | 5 | 1 | 13,850 | 1,063 | 2,239 | 1,067 | 2,389 | 5,695 | 10.9% | |
|
|
||||||||||||
| Totals - Secondary Service Area | 1010av | 1036av | 17av | 9av | 152,109 | 9,397 | 19,166 | 9,527 | 23,574 | 52,267 | 34.4% | |
| % of total population | 100% | 6.2% | 12.6% | 6.3% | 15.5% | 34.4% | ||||||
|
|
||||||||||||
| % of 5-34 population | 36.7% | 18.2% | 45.1% | 100.0% | ||||||||
Epping is located 18km north of Melbourne, bound by Mill Park and Lalor to the south, Somerton to the west, South Morang to the east and Wollert to the North. It has a mainly flat terrain though, towards the north lie several large hills, which provide an excellent view of Melbourne. McDonalds Road and High Street are the main thoroughfares. The majority of commercial activity is located on High Street and Cooper Street, where Epping Plaza, one of the major shopping centres in Melbourne is located 500m from Epping train station. The Northern hospital adjoins it with ample adjacent undeveloped land. Epping station is the terminus for the Epping railway line but there is a reserve farther north for a proposed line to Mill Park and South Morang. The east-west bus route runs in conjunction with the train line to and from South Morang to Epping Plaza. Several bus routes operate within the area which connects commuters with train and tram services. Dalton Village, is a small shopping centre (currently undergoing extension) which is located on Dalton Rd in Epping. Plus there are many parks and reserves scattered all over the area. St Monica's College is one of the biggest Catholic High Schools in Australia, and Mill Park Secondary College is the second largest public school in Victoria, with its senior campus located in the east of Epping. Northern Melbourne Institute of TAFE (NMIT) Epping campus is also located next to the station.
The growth around Epping is large and rapid, similar to Narre Warren in the south-east. There are numerous rapidly developing suburbs partly in its core service area, but mostly in its secondary catchment. These include Craigieburn, Roxburgh Park and Whiittlesea. This northern location provides a more viable ice sports catchment than Geelong. It has about 30,000 less people in the target population age band (5-34) compared to the inner metro locations, but that will be achieved over the next 5-10 years. In the meantime, its secondary catchment is quite adequate to ensure its has sufficient patronage to be viable. There has never been an ice rink located north of the city. Puckhandlers Indoor Stadium has a 50 x 26m inline hockey rink at the corner of Blake and Davis Streets, Reservoir, on the southern boundary of this core service area.
![]()
| Target population x age band | ||||||||||||
|
|
||||||||||||
| SEIFA | State Growth Rank | Jnr | Snr | Open | All | % Total | ||||||
|
|
|
|
||||||||||
| Northern core service areas | IER | IRSD | Fastest | Largest | Total | 0-4 | 5–14 | 15–19 | 20-34 | 5-34 | 5-34 | |
|
|
||||||||||||
 |
Whittlesea (C) - South-West | 892 | 963 | 10 | 8 | 61,154 | 3,718 | 8,064 | 4,163 | 14,073 | 26,300 | 28.5% |
| Darebin (C) - Preston (65%) | 1055 | 945 | 29 | 17 | 55,578 | 3,363 | 5,702 | 3,332 | 13,694 | 22,728 | 24.6% | |
| Whittlesea (C) - South-East | 892 | 963 | 10 | 8 | 44,374 | 2,962 | 6,580 | 3,699 | 9,917 | 20,196 | 21.9% | |
| Whittlesea (C) - North (75%) | 924 | 1041 | 10 | 8 | 17,998 | 1,721 | 2,932 | 1,193 | 4,265 | 8,390 | 9.1% | |
| Hume (C) - Craigieburn | 953 | 992 | 6 | 5 | 13,918 | 1,167 | 2,613 | 1,152 | 3,088 | 6,853 | 7.4% | |
| Hume (C) - Broadmeadows (18%) | 914 | 864 | 6 | 5 | 11,682 | 808 | 1,711 | 935 | 2,582 | 5,228 | 5.7% | |
| Banyule (C) - North (12%) | 1166 | 1028 | 58 | 51 | 6,646 | 387 | 775 | 467 | 1,407 | 2,649 | 2.9% | |
|
|
||||||||||||
| Totals | 971av | 971av | 12av | 9av | 211,350 | 14,126 | 28,377 | 14,940 | 49,026 | 92,343 | 43.7% | |
| % of total population | 100% | 6.7% | 13.4% | 7.1% | 23.2% | 43.7% | ||||||
|
|
||||||||||||
| % of 5-34 population | 30.7% | 16.2% | 53.1% | 100.0% | ||||||||
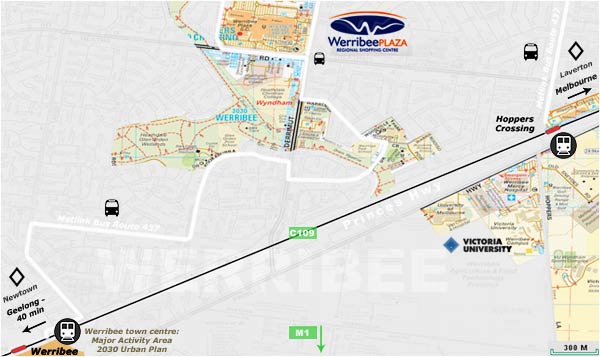
The South-western corridor presents two alternative short-term locations: Werribee or Geelong. In the longer term, ice centres will be viable at both locations. Werribee is about 32 km south-west of Melbourne, located halfway to Geelong on the Princes Highway. It has an area of 23.8 km2 and a population of 36,641 (density 1,540 km2). It is part of Wyndham LGA (pop. 116,000) which is projected to grow to 178,065 by 2020 (DSE). Greater Geelong, Victoria's second largest urban area, is a 40 minute drive (41km) from Werribee along the Princes Freeway or via the V/Line rail service. The population of Greater Geelong is about 206,000 and it is projected to reach about 244,000 by 2020 (DSE). That will still be about one-third less populated than the main locations in the Melbourne suburban area and Geelong is growing less and slower than Werribee. In 10 to 15 years time, population in Werribee's service area is projected to grow to about the size of today's Greater Geelong area. In the short-term (10 year horizon), an ice centre will be viable at either location, but not both, and afterwards a centre will probably be viable at each location. Given Werribee's larger and more rapid growth; its additional secondary catchment of parts of the Melbourne metro area; and almost half its population in the target age band (5-34), it is likely to receive similar patronage to Geelong in the short-term. It may therefore be a better strategic location, with Geelong 40 minutes distant in its secondary catchment, until such time as each can viably support a rink. The Werribee-Geelong combined core and secondary catchments are very similar to the Newcastle-Lake Macquarie location model (over 320,000 people), but with 15 to 20 minutes extra travel time for Geelong patrons (an extra 20 km or so compared to Warners Bay - Newcastle urban areas). If short-term locations were reversed, a rink located at Geelong would probably not attract as many patrons from Werribee. The Western Suburbs centre at Sunshine would be 15 km closer to Werribee than Geelong, with comparable road access. The City ice centre would also be slightly more acesssible from Werribee than Geelong.
Werribee is a more self-contained city compared with most outer suburbs of Melbourne. With a full range of schools, community facilities and shops (including the ever-expanding Werribee Plaza shopping centre) its residents seldom need to travel more than 3 or 4 kilometres except possibly for work. It also has an open range zoo and a racecourse. The old Werribee town centre located in Watton Street continues to thrive and was recently nominated by the State government as a major activity centre under the Melbourne 2030 urban plan. Following upgrades, the Melbourne Water plant's presence is not noticed, and indeed has become an asset, attracting diverse bird life. Werribee today is the major centre within the City of Wyndham, one of Melbourne's fastest growing municipalities. Local facilities and cheap housing (2006 average house price $220 000) has made it popular with young families and first homebuyers. With Werribee now largely built out, most new housing in the area is being constructed at Wyndham Vale, Tarneit and Point Cook. Werribee has never had an ice rink but one operated at Geelong for a few years between 2000-04. Laverton Skate Centre conducts general, inline and aggressive skating 12 minutes north of Werribee at 2 Oakdene Grove, Laverton. Rollerway does the same at 6 Lambert Avenue, Newtown, Geelong (black diamonds on map above).
| Target population x age band | ||||||||||||
|
|
||||||||||||
| SEIFA | State Growth Rank | Jnr | Snr | Open | All | % Total | ||||||
|
|
|
|
||||||||||
| South-west core service areas | IER | IRSD | Fastest | Largest | Total | 0-4 | 5–14 | 15–19 | 20-34 | 5-34 | 5-34 | |
|
|
||||||||||||
 |
Wyndham (C) - North | 989 | 1011 | 3 | 2 | 77,597 | 5,735 | 12,094 | 6,131 | 17,481 | 35,706 | 66.1% |
| Wyndham (C) - West | 908 | 1008 | 3 | 2 | 21,792 | 1,740 | 3,556 | 1,653 | 5,077 | 10,286 | 19.0% | |
| Wyndham (C) - South | 1014 | 1064 | 3 | 2 | 16,612 | 1,945 | 2,460 | 767 | 4,832 | 8,059 | 14.9% | |
|
|
||||||||||||
| Totals - Core Service Area | 970av | 1028av | 3 | 2 | 116,001 | 9,420 | 18,110 | 8,551 | 27,390 | 54,051 | 46.6% | |
| % of total population | 100% | 8.1% | 15.6% | 7.4% | 23.6% | 46.6% | ||||||
|
|
||||||||||||
| % of 5-34 population | 33.5% | 15.8% | 50.7% | 100.0% | ||||||||
|
|
||||||||||||
| Totals - Gr. Geelong (S-T) | 1001av | 1022av | 18 | 7 | 205,929 | 12,407 | 27,005 | 14,405 | 39,893 | 81,303 | 39.5% | |
| % of total population | 100% | 6.0% | 13.1% | 7.0% | 19.4% | 39.5% | ||||||
|
|
||||||||||||
| % of 5-34 population | 33.2% | 17.7% | 49.1% | 100.0% | ||||||||
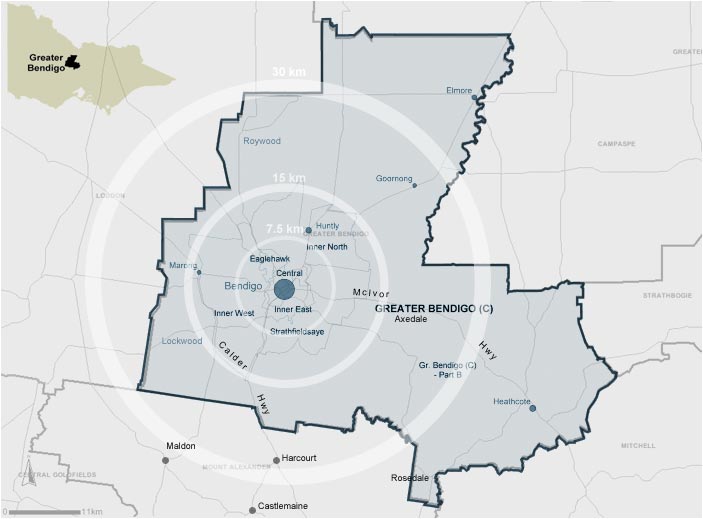
Bendigo is a small city with a steadily growing urban population of about 100,000 people which places it as the third largest regional centre in Victoria after Geelong and Melbourne. It was the centre of Australia's gold rush in the 1850's and 1860's. Bendigo's architecture hints at the phenomenal wealth extracted from the soil below. It is possibly the most elegant and impressive Victorian-era city of its size anywhere. Most of the gold mining stopped early in the 20th Century, but it is said there is as much gold remaining in the ground as was ever extracted, and today there is significant renaissant modern-era gold mining activity far underground. Bendigo is growing steadily whilst small surrounding rural towns (such as Elmore, Rochester, Inglewood, Dunolly and Bridgewater) are in steep decline. Its growth rate is 2%, which is higher than the Victorian average of 1.4%. Net in-migration accounts for about one third of Bendigo's growth. This consists of 30-40 year olds and 15-19 year olds, attracted by educational, employment and other opportunities and retirement. Outward migration is made up mainly of 20-29 year olds, possibly leaving for further education, lifestyle/experience and employment in larger cities. The population is comprised of 10,175 couple families, and 4,091 one parent families.
Bendigo is about 150 km (93 mi) or less than two hours drive by car from Melbourne on the Calder Freeway. The residual dual carriageway roads (currently about 100 km) are progressively being replaced by freeway. Regular rail services to Melbourne operate over the Bendigo railway line that was upgraded as part of the Regional Fast Rail project completed in 2006 (84 minutes Bendigo to Melbourne). There are also additional train services to and from Swan Hill, and Echuca. One train daily stops at the suburban station of Kangaroo Flat, two trains daily run Northward to Swan Hill and serve another suburban station at Eaglehawk on the way. A third train on weekdays runs through from Melbourne and originates/terminates at Eaglehawk. Two trains each week (Friday and Sunday) run north-eastward from Bendigo to Echuca. The following suburbs and localities are served by buses: Ascot, Big Hill, California Gully, Deborah Triangle, Eaglehawk, Eaglehawk North, Epsom, Flora Hill, Golden Square, Ironbark, Jackass Flat, Junortoun, Kangaroo Flat, Kennington, Huntly, Maiden Gully, Mandurang, North Bendigo, Quarry Hill, Sailor's Gully, Spring Gully, Strathdale, Strathfieldsaye, West Bendigo and White Hills. Until 1972, Bendigo possessed a wonderful little electric street tramway network. Although it was closed in that year (the last tram network closure in Australia), all the trams and almost half the track were retained as a tourist tramway, which now operates hourly or more frequent tours every day as Bendigo Talking Trams.
Bendigo was the host to the second 2004 Commonwealth Youth Games and the 1985 World Orienteering Championships. Bendigo Amateur Soccer League organises and manages soccer for over 2000 juniors and seniors in Central Victoria. Cricket and Australian rules football are the most popular sports. The Bendigo Bombers are a semi-professional Australian Rules team that competes in the Victorian Football League and the region is also home to the historic Bendigo Football League, a strong local Australian rules football competition. The Bendigo Cup is a famous horse racing event. The Bendigo Madison is a large prestigious cycling event, attracting international calibre cyclists. Basketball is popular, the city is home to the $10 million Schweppes Centre, in Marong Rd (Calder Hwy) Golden Square, home of the Bendigo Braves. It attracts over 10,000 patrons each week for major sports events, concerts, dinners, conventions, trade shows and special events. The Centre operates as a sports venue for regular competitions with the flexibility to be used for major cultural or entertainment events, and as a licensed Club catering for 6,000 members. The stadiums hosted basketball during the 2006 Commonwealth Games. The Bendigo Spirit play in the WNBL, the premier national female basketball competition. The Bendigo Fighting Miners, the only Rugby Union team in Bendigo, completes in the Victorian Country Rugby Union Competition and has won the premiership for the last four years in a row. There are 5 running baseball clubs in the Bendigo area: Eaglehawk Falcons, Bendigo East, Maiden Gully Scots, Bendigo BLS Bushrangers and Strathfieldsaye Dodgers. All of these clubs have been struggling for players for the past 5 years in both senior and junior sides. Bendigo participates in the annual VPBL state championships held across the state. In 2007, Bendigo won the U/18 event held in Wangaratta, and the U/12s were 2nd in Mildura. The CVHA Blazers field hockey team represent Bendigo at State level in both male and female competitions.
The ice rink in Hattam Street, Golden Square, is one of only two running in Victoria. It opened in 1986 and was managed by the local YMCA until it closed at the start of 2008 due to insolvency. It will re-open again for the 2008 winter with the aid of a interest-free Council loan to Bendigo Ice Skating Association (BISA). The problems and loan arrangements are detailed in the Ordinary Council Meeting Minutes (Mar 5th, 2008). Bendigo Council has previously provided interest free loans to BISA. A sum of $80,000 was borrowed in 2000 for a ten year period and was repaid in 6 years. BISA propose to reduce costs by 60% by replacing staff with volunteers for kiosk, reception and cleaning. They remain as managers reporting to the Board which includes Council officers. They successfully argued that reducing staff costs and improving marketing (blue light discos and more advertising) will result in sufficient income to repay the loan, but they have hefty plant maintenance over the next 4 years (2008: $34,700; '09: $10,000; '10: $10,000; '11: $25,000). The rink has operated over a period of 21 years, fourth longest after South Gate, St Kilda and Oakleigh. The major problem is the aging ice plant, which has been estimated to cost more than a $1 million to replace, and many doubt the present rink can remain financially viable. It has very limited bench seating and its ice pad is 53m by 27m; not international-size, but considerably larger than Oakleigh. It is located in an industrial shed that has many of the same problems as Oakleigh, not least of which is unecessarily high operating costs and poor public amenities. A proposed new $5 million complex, based beside the Schweppes Centre basketball stadium, was passed by the council almost two years ago and still had not resulted in any action. The problem, of course, is funding. Bendigo Raiders Ice Hockey Team competes at both junior and senior levels within the Ice Hockey Victoria championships. It is the only team to play that is located outside Melbourne (Geelong Cougars folded when the Geelong rink closed in 2005). The BISA has both beginner and national figure skaters and the Bendigo rink hosted the Australian National Curling Championships in 2007. This rink cannot host International tournaments or National hockey championships.
The City of Greater Bendigo has an area of 3,048 square kilometres with a population of 96,700 (2006). It is comprised of the former City of Bendigo, Borough of Eaglehawk and Shires of Strathfieldsaye, Huntly, Marong and later Shire of McIvor, amalgamated under State Government reforms. Its population density is only about 41/km2, a fraction of the Melbourne metro area. Regional service catchments are, of course, much larger than metropolitan Melbourne because of quicker travel time on less congested roads. Marong to Bendigo is about 15km and takes about 15 minutes by road so the core catchment is defined by a 15 km radius of an ice centre (map above). The secondary catchment will extend a farther 15km beyond that; farther again for some. For example, Maldon to Bendigo is a 38 km trip that takes about 40 minutes by road. Compared to an average Melbourne metro CORE service area, the FULL service catchment of Bendigo has about one-third the target population (5-34); about 40 percent of its Junior (5-14) and Senior (15-19) age bands, and 30 percent of its Open age band (20-34; lower due to out-migration). Bendigo is also about one-third the size of the Newcastle locality model and much less densely populated.
| Target population x age band | ||||||||||||
|
|
||||||||||||
| SEIFA | State Growth Rank | Jnr | Snr | Open | All | % Total | ||||||
|
|
|
|
||||||||||
| Bendigo core service areas | IER | IRSD | Fastest | Largest | Total | 0-4 | 5–14 | 15–19 | 20-34 | 5-34 | 5-34 | |
|
|
||||||||||||
 |
Gr. Bendigo (C) - Central | 1049 | 952 | 14 | 15 | 18,499 | 1,213 | 2,239 | 1,346 | 4,221 | 7,806 | 19.8% |
| Gr. Bendigo (C) - Eaglehawk | 983 | 925 | 14 | 15 | 8,895 | 583 | 1,300 | 644 | 1,598 | 3,542 | 9.0% | |
| Gr. Bendigo (C) - Inner East | 1007 | 1032 | 14 | 15 | 24,357 | 1,297 | 2,944 | 2,069 | 5,395 | 10,408 | 26.4% | |
| Gr. Bendigo (C) - Inner North | 1026 | 1011 | 14 | 15 | 10,015 | 655 | 1,566 | 750 | 1,907 | 4,223 | 10.7% | |
| Gr. Bendigo (C) - Inner West | 1015 | 1007 | 14 | 15 | 16,513 | 1,157 | 2,492 | 1,189 | 2,996 | 6,677 | 16.9% | |
| Gr. Bendigo (C) - S'saye | 1009 | 1103 | 14 | 15 | 6,801 | 499 | 1,294 | 517 | 1,051 | 2,862 | 7.2% | |
| Gr. Bendigo (C) - Pt B | 977 | 985 | 14 | 15 | 11,661 | 611 | 1,786 | 809 | 1,382 | 3,977 | 10.1% | |
|
|
||||||||||||
| Totals — 15 km rad. | 1009av | 1002av | 34 | 15 | 96,741 | 6,015 | 13,621 | 7,324 | 18,550 | 39,495 | 40.8% | |
| % of total population | 100% | 6.2% | 14.1% | 7.6% | 19.2% | 40.8% | ||||||
|
|
||||||||||||
| % of 5-34 population | 34.5% | 18.5% | 47.0% | 100.0% | ||||||||
|
|
||||||||||||
| Loddon (S) - North | 923 | 1045 | 78 | 77 | 3,307 | 220 | 474 | 207 | 465 | 1146 | 12.1% | |
| Loddon (S) - South | 889 | 960 | 78 | 77 | 4,788 | 230 | 612 | 275 | 510 | 1397 | 14.8% | |
| Mount Alexander (S) - C'maine | 943 | 991 | 39 | 55 | 7,398 | 386 | 858 | 441 | 1066 | 2365 | 25.0% | |
| Mount Alexander (S) Bal | 1028 | 983 | 39 | 55 | 10,258 | 549 | 1493 | 677 | 1163 | 3333 | 35.3% | |
| Campaspe (S) - South | 1123 | 1003 | 39 | 46 | 3,792 | 169 | 509 | 247 | 452 | 1208 | 12.8% | |
|
|
||||||||||||
| Totals — 15-30 km rad. | 981av | 996av | 55av | 62av | 29,543 | 1,554 | 3,946 | 1,847 | 3,656 | 9,449 | 32.0% | |
| % of total population | 100% | 5.3% | 13.4% | 6.3% | 12.4% | 32.0% | ||||||
|
|
||||||||||||
| % of 5-34 population | 41.8% | 19.5% | 38.7% | 100.0% | ||||||||
|
|
||||||||||||
| Totals — nom. 30 km radius | 995av | 999av | 34 | 15 | 126,284 | 7,569 | 17,567 | 9,171 | 22,206 | 48,944 | 38.8% | |
| % of total population | 100% | 6.0% | 13.9% | 7.3% | 17.6% | 38.8% | ||||||
|
|
||||||||||||
| % of 5-34 population | 35.9% | 18.7% | 45.4% | 100.0% | ||||||||
Unfortunately, the particular problem facing Bendigo is that the Council has declared that they are reliant on State government funding, but an ice centre located at any one of five locations in the Melbourne metro area will serve about three times as many people or more. Four other locations are up to twice the size of Bendigo and are projected to develop more rapidly. Similarly, a rink at Geelong would serve twice the number at Bendigo. Even if there were government funds available for future ice centres, they would be more effectively deployed in the Melbourne metro area, in the overall best interests of ice sports in Victoria. Regional centres in Victoria are not at all like those in NSW, such as Newcastle. They are much less populated over greater distances. Future facility development in Victoria should be first focused as a priority on the West, East and South-east of Melbourne's densely populated suburban area. The Western Suburbs rink strategy can service Greater Bendigo in ways that are yet to be properly investigated, although it will mean an hour and a half train travel (2 hours by road) each way. But that is a shorter journey than Oakleigh, and accommodation there would foster better training and development programs with other teams and weekend competitions.
There is a second issue with regional centres. In 2007, Melbourne-based hockey teams traveled to Bendigo whilst the Bendigo team played at home all season. Match forfeits by some Melbourne teams were at an unprecedented high and very few teams looked forward to the trips. The idea assisted Bendigo, but it took a heavy toll in Melbourne. For many, it meant giving up a whole day each trip, and travel and related expenses added heavily to the financial cost of participation. That has factored in the general decline of ice hockey participation levels in Melbourne for some time, whether or not the organisers are prepared to acknowledge it. To restore and boost participation, the sport needs to be as accessible as possible to the largest number; not the other way around. That form of assistance was not, and never could be, sufficient to fix the Bendigo centre's debt, and the centre still had to close following the 2007 winter season. Melbourne teams cannot subsidise Bendigo in that way because it makes the sport less attractive there, and metropolitan Melbourne can no more afford to lose participants than Bendigo. In fact, Melbourne is far, far worse-off per capita. It now has one club per 1 million people compared to Bendigo's one club per 0.13 million. A strategically-located Western Suburbs rink with hostel-style accommodation would be a far more effective short-term solution until Bendigo has built-up its numbers, and any financial resources available after the City centre, would best be focused on that as the next priority. Participation in ice hockey at Bendigo is about 0.9 players/1000 population in the 5-34 year age band. That is 70 percent of State average (1.3/1000) and well under half the participation rate at the model centre (2.2/1000; Warners Bay, NSW). No-one wants to lose the Bendigo rink, but the viability of its ice sports cannot be sustained at the expense of a greater majority elsewhere. A sensible facility development strategy for ice sports in Victoria would resource those locations that provide the greatest benefit in priority order, catering as far as is viable for the smaller population centres. Otherwise, ice sports — particularly team sports — will continue to reduce State-wide, to the lowest common denominator.
The ice centre idea for the Schweppes Centre will improve rink viability, but every effort will need to be made to keep debt service to a minimum and to avoid cutting corners on the sustainable building technology needed to keep ongoing running costs to an absolute minimum. Otherwise, the centre will fail. However, even then and for some time to come, ice sports would still need to be more heavily promoted in Bendigo than they have been, and more so than in most other places. Organisers need to attract a greater percentage of recreationalists and athletes in the target population (5-34) from their relatively lightly populated service area. The remarkable sporting achievements in Bendigo belie its size; it is capable of thinking big. Ice sports and recreation there would benefit immediately from a program similar to 'Figure Skating in Harlem' (New York City) and the subsequent 'Disney Goals' program which were originally developed to foster teamwork, discipline and self-esteem for local youth. In addition to recreation, 'Goals' offers scholarships, internships and other educational programs. In particular, they organise sponsoring a child, often those with limited financial resources, to cover some or all of the costs of participation, such as tutoring and equipment. A similar program tailored to local youth could be developed right now, jointly by the YMCA, BISA and the local ice hockey league, with assistance from local and State government sports grants (which are separate to capital facility grants). A program such as that will add to promotion and marketing of local ice sports through local press, community organisations, businesses, schools and the the Schweppes Centre facility and its programs. Local youth-worker groups would no doubt assist. There is a section of the target ice sports age band that cannot quite afford to participate and Bendigo, more than most, needs every participant it can muster. Some say more ice is needed, but that is not so. More can participate on the Bendigo rink, especially since one-sixth of all IHV hockey will not be scheduled there in 2008, as it was in 2007.
Broad indications are that Bendigo is about average in terms of economic disadvantage and resources (table above). In fact, when you look more closely (map below), Bendigo CBD is surrounded by disadvantage, and so is most of the the west of Bendigo from Kangaroo Flat through Golden Square, where the rink is located, to Long Gully, Ironbark, California Gully, Jackass Flat, southern Eaglehawk, westward and beyond. All have more socio-economically disadvantaged households compared to the National average, which means Bendigo's small catchment is not the only challenge. Finding one or two thousand dollars from gross household incomes less than $55,000 can be a struggle, but that is what is needed for just a single child there to participate in the basics of ice hockey. From a public policy viewpoint, that makes the sport even less accessible to even fewer people. There is relative disadvantage throughout all Victoria, not just Bendigo. But therein lies an opportunity to develop greater participation in ice sports — in this case, in the two or three darkest areas on the map, and in the Rosedale-Heathcote areas beyond. A good many young people living there would happily participate if they could afford to. Instead, they play football and cricket in large numbers, and not only because they are popular; also because football and cricket don't cost around $1,000 each year, as ice sports do, plus long-distance traveling costs and related expenses. Unlike ice hockey, most country sports do not require weekly travel to Melbourne in order to compete. But that is the case for Bendigo ice hockey teams and it won't change until there are a sufficient number of participants to enable teams to compete at home. A return train ticket to Melbourne for two children and two adults costs $90.00; $30.00 adult single and $15.00 for a child aged 4-14yrs. For a Bendigo junior player and accompanying parent, the travel costs of playing most or all rounds of hockey at Oakleigh is over $1,000 per season; more than twice the player registration and ice costs. Journey costs to an ice centre located at Sunshine are one-third less. A community bus is probably even less costly for groups, and if it was sponsored through a skating program it would be less again.
Bendigo may well be marginal for mainstream sport and recreation public funding because, at the moment, competitive ice sports there only benefit a much smaller proportion of the broader community, compared to the more heavily populated areas of Melbourne and Geelong. The direct beneficiaries are those who can afford to participate and, in the case of competitive team sports like ice hockey, those who can also afford the time and cost of regular, long-distance journeys. A Bendigo ice centre might simply be too specialised to compete against most other types of sports facilities for government funding. The competition serve more people, irrespective of their income and means, at a much lower cost of participation. The population of Greater Bendigo is projected to increase by about one-third (30,000 people) by 2031 (DPI), but with significant out-migration of 20-29 year olds (the ice sports Open age band). By then, Bendigo may be home to about 160,000 people, but that is still much lower than all strategic locations.
More waiting may not be the best strategy. For example, this city is home to the Bendigo Bank headquarters, now a large retail bank with community branches throughout Australia. It is a major Bendigo employer (with a regional office at Melbourne Docklands) and a leader in community initiatives designed to help communities with commercial enterprises that retain and build local capital. A youth program based on skating would be suited to several of their initiatives, including their Community Enterprise Foundation; Lead On program (youth development); and community event sponsorships. It could even become a nation-wide model for Bendigo Bank's community-focus and business development — at home, where charitable service begins. The Bendigo ice community and local Council do have some means to become more strategically focused, co-ordinated and aggressive in their approach to promotion and growth of ice sports. Participation levels would almost certainly increase. Finance for the Council-approved but presently unfunded, purpose-built ice centre would then provide a much better return on investment; satisfy more need; better meet government sport and recreation policy objectives. In turn, the proposed centre would attain a higher priority State-wide, and it would be more likely to eventuate sooner rather than later.
Unfortunately, participation levels in the State are now so low that pro-active intervention is unavoidable. That may change over time, as ice sports re-establish lost ground, and economies of scale in the cost of participation kick-in again. The extra effort required now, should not be necessary forever. Bendigo's socio-economics and small population will, however, require more community effort than at the strategic locations for ice centres, for some time to come. Ice sports in Melbourne are not yet positioned to effectively ease Bendigo's twin hardships of travel and participation costs in a sustainable way, although odd attempts have been made. In 2008, Ice Hockey Victoria set costs for Bendigo ice hockey players 20 percent lower than Melbourne for Pee Wee; 30 percent lower for Junior Elite and 25 percent lower for Premiers. Melbourne players continue to subdise Bendigo participation, even though there are greater needs in Melbourne. A sustainable strategy for Bendigo will include the Western Suburbs ice centre. It would substantially ease the additional burden of travel and associated costs for Bendigo athletes, particularly the 'would-be' ice athletes who just can't afford it. Yet, it is hard to see how that can happen if, unlike other States, the sports' own organisers continue to choose to view advocating and promoting ice centre development as separate to their sports, and therefore someone else's responsibility. The two are inseparable here, and sometimes the obvious solution is not the best.
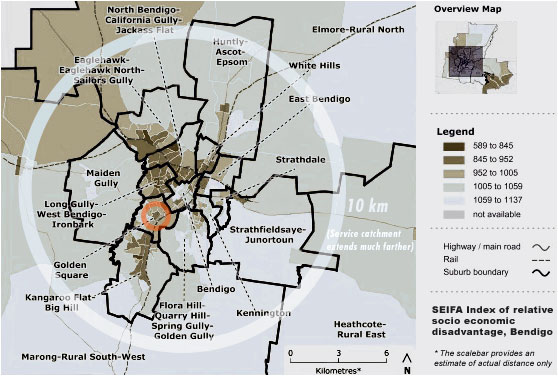
Future ice: the key to Bendigo's small, dispersed service catchment.
Many people living in the 2 or 3 areas shaded darkest are least able to afford ice sports.
< 1000; shaded darkest: below the National average — areas with many low income earners.
> 1000; shaded lightest: above the National average — relatively less disadvantaged.
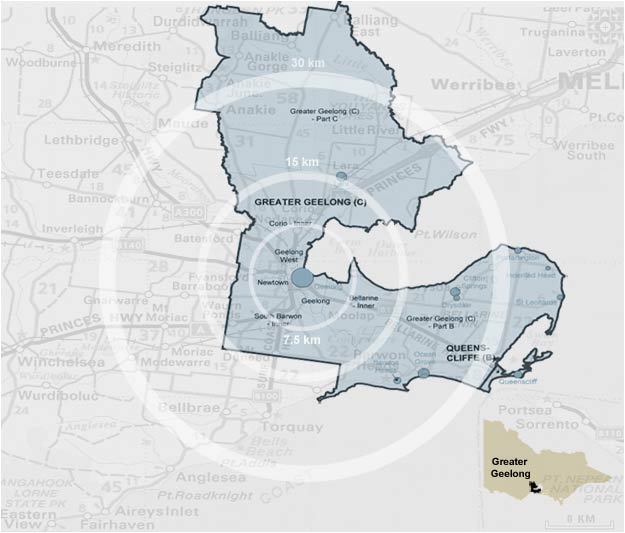
The City of Greater Geelong is located on Corio Bay and the Barwon River, 75 kilometres south-west of Melbourne. It has an area of 1,240 square kilometres; a population of 191,000 (2006), and a density of 165.23/km2. Created in 1993, it is an amalgamation of parts or wholes of the former municipalities of the Shire of Barrabool, Shire of Bannockburn, Shire of Bellarine, Shire of Corio, City of Geelong, City of Geelong West, City of Newtown, and City of South Barwon. Geelong is the second largest city in the State, and the largest regional centre. It is a port city with an urban population of 160,991 people, and a growth rate higher than the national average. It is the 12th largest city in Australia. The urban area runs from the plains of Lara in the north to the rolling hills of Waurn Ponds to the south, with the bay to the east and hills to the west. Geelong is also the gateway to tourist attractions including the Great Ocean Road and the Shipwreck Coast. Geelong now has 206,000 people in the City of Greater Geelong and approximately 260,000 in the immediate vicinity.
As of the 2006 Census, the urban population resided in 68,000 households. The median age of persons in Geelong was 37 years and 19.4% of the population were children aged between 0-14 years, and 26.6% were persons aged 55 years and over. Each dwelling is on average occupied by 2.59 persons, slightly lower than the State and National average. The median household income was $901 per week, $121 less than the State average, partly due to higher reliance on manufacturing for employment. The population of Geelong is growing by 2000 people each year, and the City of Greater Geelong had the highest rate of building activity in Victoria outside metropolitan Melbourne. More than 10,000 businesses employ over 80,000 people in the Geelong region, with manufacturing and processing industries providing around 15,000 jobs, followed by 13,000 in retail, and 8,000 in health and community services. Geelong's major employers include the Ford Motor Company engine plant in Norlane, aircraft maintenance at Avalon Airport, the head office of retail chain Target, the Bartter (Steggles) chicken processing plant, Alcoa's Point Henry aluminium smelter, and the Shell oil refinery at Corio. Geelong has a number of shopping precincts in the CBD and surrounding suburbs. The two main shopping centres are located in the CBD — Westfield Bay City and Market Square — with smaller centres in the suburbs including Belmont Plaza and Waurn Ponds Shopping Centre in the south, Bellarine Village in Newcomb in the east, and Corio Village Shopping Centre in the north.
Geelong has an array of events and festivals from the multicultural Pako Festa to the Australian International Airshow to Australia's largest yachting regetta Skandia Geelong Week. Other festivals hosted in the Geelong region include the Meredith, and Queenscliff Music Festivals, the cultural Poppykettle Festival, National Celtic Festival, the fundraising Gala Day, and the Royal Geelong Show. The city also hosts a number of sporting events, including home games of the Geelong Football Club, the Geelong Cup, the Bay Classic Series and Geelong leg of the UCI Women's Road World Cup cycling events, the 2009 Australasian Masters Games, the 2010 UCI World Road Cycling Championships, and the Head Of The Schoolgirls rowing regatta. Geelong is home to the Geelong Football Club Australian Football League team, the second oldest AFL club and one of the oldest in the world. For many years it was the only VFL/AFL club to exist outside of the greater Melbourne metropolitan area. It continues to participate in the national competition, based out of the Kardinia Park stadium and Telstra Dome in Melbourne, and also fields a reserves side in the Victorian Football League. There are also 3 football leagues running in the area, including the Geelong Football League, the Bellarine Football League and the Geelong & District Football League. The annual Geelong Cup thoroughbred horse race was first run in 1872, and is considered one of the most reliable guides to the result of the Melbourne Cup. The Arena stadium in North Geelong is the home of the Geelong Supercats basketball team, and was also used during the 2006 Commonwealth Games for basketball matches. The Eastern Beach foreshore and nearby Eastern Gardens is regularly host to internationally televised triathlon events and annual sports car and racing car events such as the Geelong Speed Trials. Corio Bay is also host to many sailing and yachting events. Geelong also boasts many golf courses, sporting and recreation ovals and playing fields, as well as facilities for water skiing, rowing, fishing, hiking, and greyhound and harness racing.
Like Bendigo, relative disadvantage in family units occurs around the inner city and west at Geelong West (999), Colac Otway central (980), Geelong East (963) and Corio (914). Economic resources representing the income and expenditure levels of family units are less than the National average at Queenscliff (990), Central Geelong (976), Geelong West (973), Bellarine Peninsula (971), Surf Coast West (969), Golden Plains South East (958), Geelong East (950), Colac Otway North (949), Golden Plains North West (938), Corio (935), Colac Otway South (926), Colac Otway Central (924).
An ice rink was located at Geelong for a few years between 2000-04. Rollerway conducts general, inline and aggressive skating nearby at 6 Lambert Avenue, Newtown (black diamond on map). The South-western corridor presents two alternative short-term locations: Werribee or Geelong. In the longer term, ice centres will be viable at both locations. Greater Geelong's population is projected to reach about 244,000 by 2020 (DSE). That will still be about one-third less populated than the main locations in the Melbourne suburban area and Geelong is growing less and slower than Werribee. In 10 to 15 years time, population in Werribee's service area is projected to grow to about the size of today's Greater Geelong area. In the short-term (10 year horizon), an ice centre will be viable at either location, but not both, and afterwards a centre will probably be viable at each location. Given Werribee's larger and more rapid growth; its additional secondary catchment of parts of the Melbourne metro area; and almost half its population in the target age band (5-34), it is likely to receive similar patronage to Geelong in the short-term. It may therefore be a better strategic location, with Geelong 40 minutes distant in its secondary catchment, until such time as each can viably support a rink. The Werribee-Geelong combined core and secondary catchments are very similar to the Newcastle-Lake Macquarie location model (over 320,000 people), but with 15 to 20 minutes extra travel time for Geelong patrons (an extra 20 km or so compared to Warners Bay - Newcastle urban areas). If short-term locations were reversed, a rink located at Geelong would probably not attract as many patrons from Werribee. The Western Suburbs centre at Sunshine would be 15 km closer to Werribee than Geelong, with comparable road access. The City ice centre would also be slightly more acesssible from Werribee than Geelong.
| Target population x age band | ||||||||||||
|
|
||||||||||||
| SEIFA | State Growth Rank | Jnr | Snr | Open | All | % Total | ||||||
|
|
|
|
||||||||||
| Geelong core service areas | IER | IRSD | Fastest | Largest | Total | 0-4 | 5–14 | 15–19 | 20-34 | 5-34 | 5-34 | |
|
|
||||||||||||
 |
Corio - Inner | 1057 | 915 | 18 | 7 | 57,233 | 3686 | 8051 | 4211 | 11357 | 23,619 | 29.1% |
| South Barwon - Inner | 920 | 1044 | 18 | 7 | 50,300 | 2882 | 6253 | 3694 | 10199 | 20,146 | 24.8% | |
| Greater Geelong (C) - Pt B | 971 | 1047 | 18 | 7 | 35,024 | 1937 | 4774 | 2340 | 4858 | 11,972 | 14.7% | |
| Bellarine - Inner | 984 | 963 | 18 | 7 | 24,161 | 1525 | 3438 | 1661 | 4574 | 9,673 | 11.9% | |
| Geelong West | 1026 | 999 | 18 | 7 | 14,255 | 952 | 1528 | 795 | 3486 | 5,809 | 7.1% | |
| Geelong | 1042 | 1034 | 18 | 7 | 11,896 | 704 | 1199 | 689 | 2944 | 4,832 | 5.9% | |
| Newtown | 961 | 1098 | 18 | 7 | 9,957 | 578 | 1406 | 800 | 1756 | 3,962 | 4.9% | |
| Greater Geelong (C) - Pt C | 1046 | 1079 | 18 | 7 | 3,103 | 143 | 356 | 215 | 719 | 1,290 | 1.6% | |
|
|
||||||||||||
| Totals - Gr. Geelong | 1001av | 1022av | 18 | 7 | 205,929 | 12,407 | 27,005 | 14,405 | 39,893 | 81,303 | 39.5% | |
| % of total population | 100% | 6.0% | 13.1% | 7.0% | 19.4% | 39.5% | ||||||
|
|
||||||||||||
| % of 5-34 population | 33.2% | 17.7% | 49.1% | 100.0% | ||||||||
![]()
Notes and Bibliography
[1] Australian Bureau of Statistics, 3235.0 Population Estimates by Age and Sex, Victoria by Geographical Classification [ASGC 2006], Released at 11.30am (Canberra time) 24 July 2007
[2] Australian Bureau of Statistics, 3218.0 Regional Population Growth, Australia, Released at 11.30am (Canberra time) 24 July 2007
[3] SEIFA 2001 data is most current and was placed onto the ABS website 28/2/2006. SEIFA is a set of indexes developed by the Australian Bureau of Statistics and includes five indexes, two of which are most relevant to this strategy: (1) Index of Relative Socio-economic Disadvantage (IRSD), which focuses on items such as low-income earners and high unemployment. It takes into account variables relating to income, education, occupation, wealth and living conditions; and (2) Index of Economic Resources (IER), which highlights disposable income and the economic resources of a household. It reflects the income and expenditure of families, such as wages and rent. Variables which reflect wealth (such as dwelling size) are also included. The income variables are specified by family structure, since this affects disposable income. A higher score on the Index indicates an area has a higher proportion of families on high income, a lower proportion of low-income families and more households living in large houses, that is four or more bedrooms. A low score for this Index indicates the area has a relatively high proportion of households on low incomes and living in small dwellings. SEIFA indexes have been standardised to have a mean of 1000 and a standard deviation of 100, which means that 95% of SEIFA scores lie between 800 and 1200 (Australian Bureau of Statistics, 1998, p. 12). SEIFA scores are ordinal measures, not interval measures, and as such there is no meaningful arithmetic relationship between the values (eg., an area that has a SEIFA score of 1200 is not twice as advantaged as an area with a SEIFA of 600).
[4] Ice Hockey Victoria, Hockey Strategy Review, 2008
[5] Strengthening Canada : The Socio-economic Benefits of Sport Participation in Canada (2004), based on analysis of original data from The Conference Board of Canada’s National Household Survey on Participation in Sport, and an international literature review conducted by the Conference Board. Online
[6] Participation in Sports and Physical Recreation, Australia 2005-06, ABS cat. No. 4177.0
![]()